Product Description:
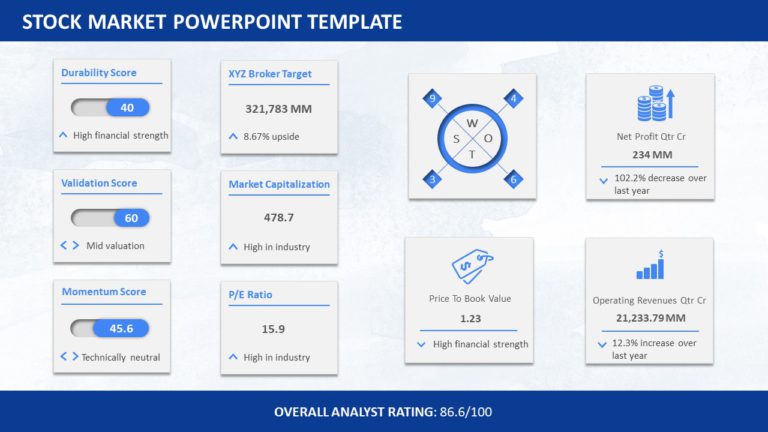
Share your ideas using this stock market analysis template that simplifies data, for better comprehension. With colorful green and red arrows illustrating market movements on the slide helps in conveying information about put options and upcoming forecasts. The design is neat and organized to highlight figures like 67 % for buyers and 34 % for sellers, in a manner.
Designed for analysts, investment advisors and corporate professionals this template is a resource, for delivering presentations, on market analysis and strategic planning. Incorporating infographics not boosts appeal but also helps maintain audience interest ensuring that your key points stick in their minds.
Enhance your stock market presentations with this crafted template for download today! Find more such Finance PowerPoint templates for engaging presentations. These templates are compatible with both PowerPoint and Google Slides.


