Product Description:
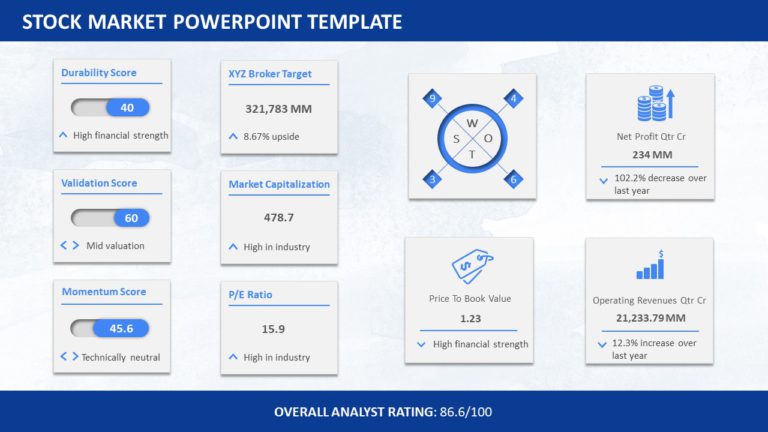
Enhance your presentations with a stock market analysis dashboard tailored for finance experts! This template showcases bar graphs. Trend trackers to simplify data presentation seamlessly in a visually appealing manner, with an organized design and elegant color scheme to captivate your audience during discussions of essential market trends.
The design consists of segments, for product effectiveness that highlight data like sales numbers and percentage shifts in an engaging manner. Visual graphics such as volume diagrams enable easy understanding of market trends and changes swiftly. Ideal, for investment experts and corporate leaders alike. This design is customized for conversations and financial assessments.
Enhance your presentations today. Convert intricate data into easily understandable insights that you can act on immediately by downloading now and captivating your audience with a refined and sophisticated appearance! Find more such Finance PowerPoint templates for engaging presentations. These templates are compatible with both PowerPoint and Google Slides.


