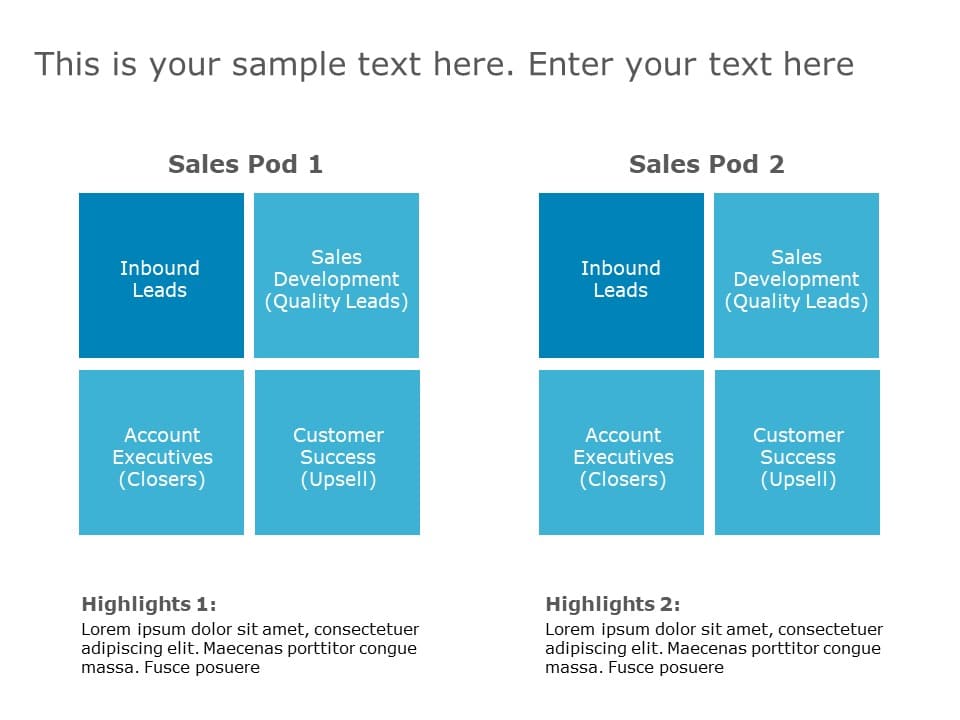
Comparison Slide & Comparison Table Collection for Presentations
What Is A Comparison Chart?
A comparison chart is a graphical tool for comparing two or more goods, products, services, or other entities. It is often displayed in the form of a table or a matrix, with each item's qualities and traits listed side by side for easy comparison. These comparison PowerPoint and Google Slides templates are largely used by marketing and strategy-related departments to evaluate the effectiveness of various plans and tactics. For instance, it's simple to compare a company's present performance to its future performance.
What Is Comparison PowerPoint Template?
A Comparison PowerPoint Template allows users to exhibit and compare two or more objects/entities side by side. It illustrates the similarities or differences between two or more products, concepts, ideas, etc. These comparison PPT templates often feature various visual aids like tables, charts, graphs, and diagrams to assist users in presenting information clearly. Mostly used comparison tools are charts, bar graphs, and Venn diagrams.
What Is The Purpose Of The Comparison Slide?
The purpose of a comparison slide is to visually highlight the differences between two or more items, concepts, products, or ideas. Comparison slides in PowerPoint are important because it differentiates two or more items, services, businesses, strategies, plans, etc. Some of the advantages of using Comparison Slides in PowerPoint presentations are:
- Easy to understand
- Understandable to a broad audience.
- Get the data comparison at a glance
- Summarize a large amount of data
How Do You Create A Comparison Infographic?
Creating a comparison infographic or comparison PPT template is an excellent way to graphically portray complicated information. You can create an excellent comparison slide template that helps your audience grasp the similarities and contrasts between distinct things or concepts with careful preparation, research, and design. Check out the steps below to create a PowerPoint comparison template:
- Set a clear objective for what you wish to compare
- Pick a comparison template that will help your audience quickly understand your thoughts
- Customize comparison slide by adding the data and text
- Summarize the data
How Do I Add Comments To A Comparison Table Template?
Adding comments to the comparison slide in PowerPoint is one of the important elements you can use. It shows the remark of the comparison. Below are ways you can add a comments comparison table.
- Left-click on the area you want to want the comment to appear either on text or diagram.
- Click on the Review tab.
- Click on the Comments group and select a New Comment option.
- The comments box will appear; type your comments and press ‘Enter’.
Related Presentation Templates
-
Pros And Cons
64 templates
-
Challenges & Solution
154 templates
-
Before After
29 templates
-
Advantages-Disadvantages
39 templates
-
Strength & Weakness
5 templates


