Product Description:
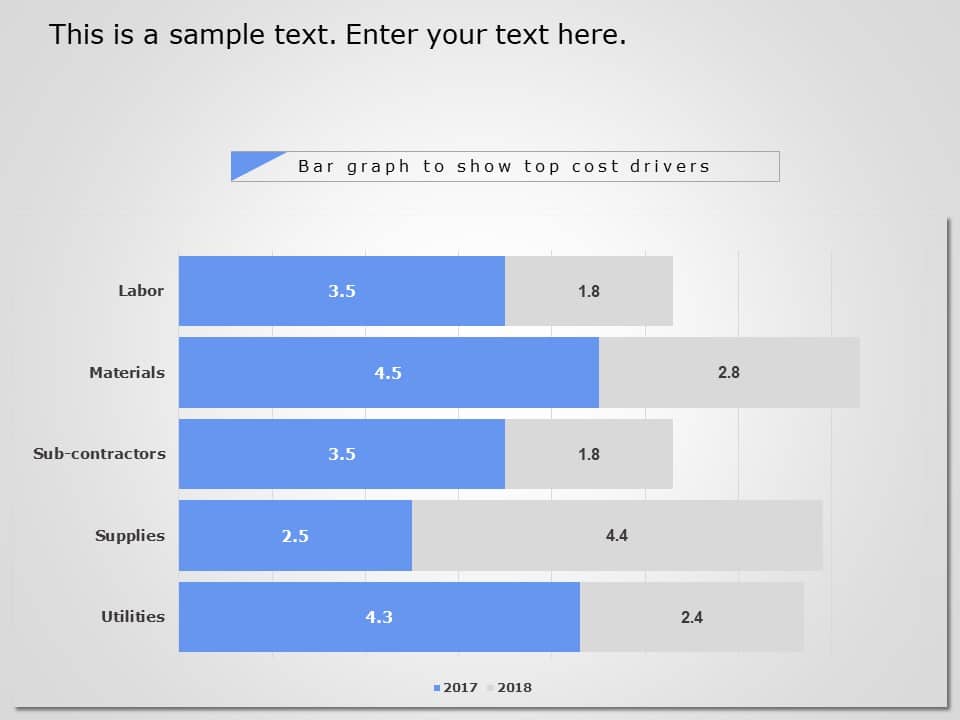
Make your presentations more impactful by using this appealing bar graph template that highlights cost factors clearly and effectively designed for financial analysts and project managers to present intricate data in an engaging manner The combination of gray colors not gives a professional feel but also helps your audience distinguish between 2017 and 2018 easily.
The design includes sections that allow for comparisons and assist in bringing out important details, about labor costs and materials usage as well as subcontractor expenses and utility bills. Perfect for assessing budgets or analyzing costs, in meetings or planning sessions aimed at making informed decisions.
Get it today. Turn your information into captivating graphics that really make your point stand out! Find more such Graphs & Charts PowerPoint templates for engaging presentations. These templates are compatible with both PowerPoint and Google Slides.


