Product Description:
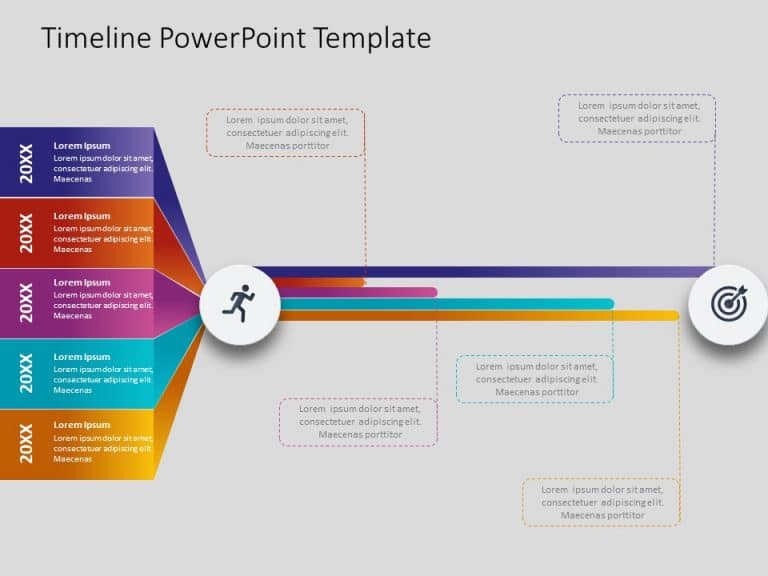
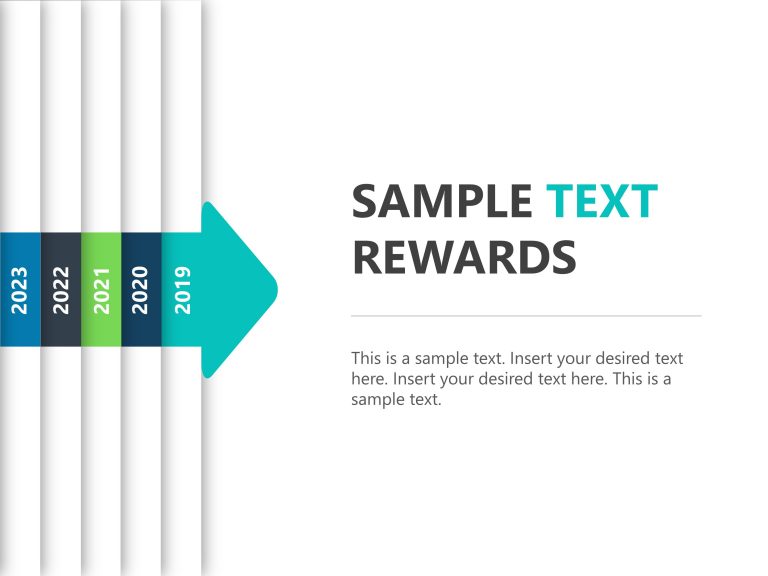
The Timeline Chart PowerPoint Template has a clear layout design to present a series of events or activities over time. The layout includes different key elements. It has monthly indicators to help users understand the timeline’s length and smoothly follow the events or activities. The colorful bars represent different months with placeholder text for event summaries.
This timeline template PowerPoint helps manage multiple tasks, such as presenting and organizing data clearly in a particular format. With the help of the carefully arranged layout and graphic features, users can easily communicate the timeline, project milestones, historical developments, or other time-based data to their audience. This Timeline Chart PowerPoint template allows you to create eye-catching timelines for presentations. Because of its simple design, presenters can quickly arrange and display time-related data, making it useful for many industries and sectors.
This template is highly helpful when showing timelines, project plans, historical events, or other logical data in a PowerPoint presentation. This template can help communicate timelines in corporate meetings, academic lectures, project updates, or training sessions to different audiences. For more such unique designs, check out our exclusive collection of PowerPoint Charts to create impactful and compelling presentations.


