Product Description:
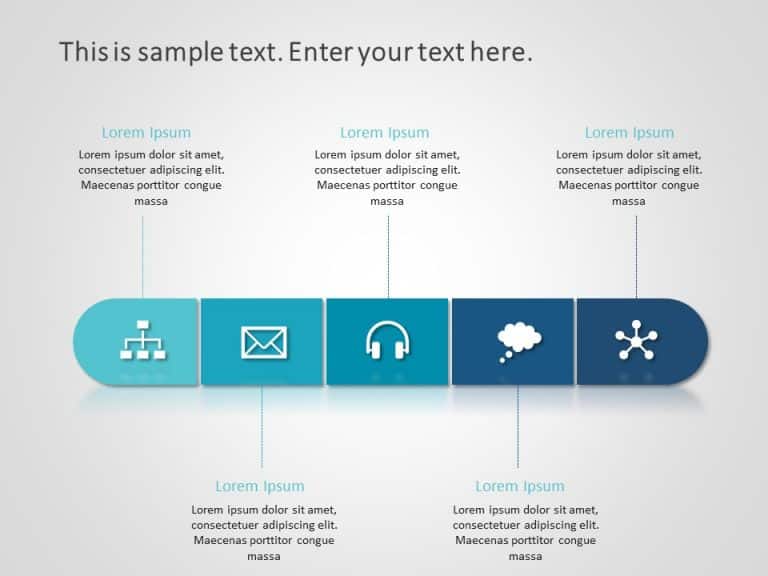
Share data easily using this timeline template crafted for data analytics projects! The attractive design layout includes a style that leads viewers through the goals and initiatives of each quarter smoothly and effectively.
The stylish layout of the template features colors that not just boost its attractiveness but also aid in distinguishing between different phases of your project easily. Tailored for business executives and professionals this template is ideal, for showcasing in gatherings, like meetings, strategy discussions or project assessments.
Make sure to use a organized layout to define your goals and desired results, for keeping your audience informed and interested. Enhance your presentations by downloading this designed timeline template ! Find more such Timeline PowerPoint templates for engaging presentations. These templates are compatible with both PowerPoint and Google Slides.


