

SWOT Analysis: The Complete Guide to Strengths, Weaknesses, Opportunities & Threats
One of the biggest challenges professionals face is a lack of structured thinking when strategizing plans, conducting competitor analysis, or evaluating current strategies. This often leads to wasted time, inconsistent evaluations, and missed opportunities.
A well-designed framework solves this problem. SWOT analysis enables in-depth comprehension of a scenario, a clear-eyed look at a business inside and out, and the development of fine-tuned solutions. It provides clarity, saves time, and delivers consistent results, empowering you to make smarter, data-driven decisions.
Sergej, CEO of Amasty, has credited a structured SWOT analysis with helping reshape his company’s strategic direction — a reminder that this isn’t just an academic exercise but a tool real operators use to make real decisions.
In this guide, you’ll learn what the framework is, its four parts, how to conduct one using a real example, and how to turn your findings into a presentation that actually drives decisions.
Quick Answer
A SWOT analysis is a strategic planning framework that evaluates four factors — Strengths, Weaknesses, Opportunities, and Threats — to give a clear, structured view of an organization, project, or idea. Strengths and weaknesses are internal factors a business controls; opportunities and threats are external factors shaped by the market. Teams use it to guide planning, prioritize initiatives, and make better-informed decisions.
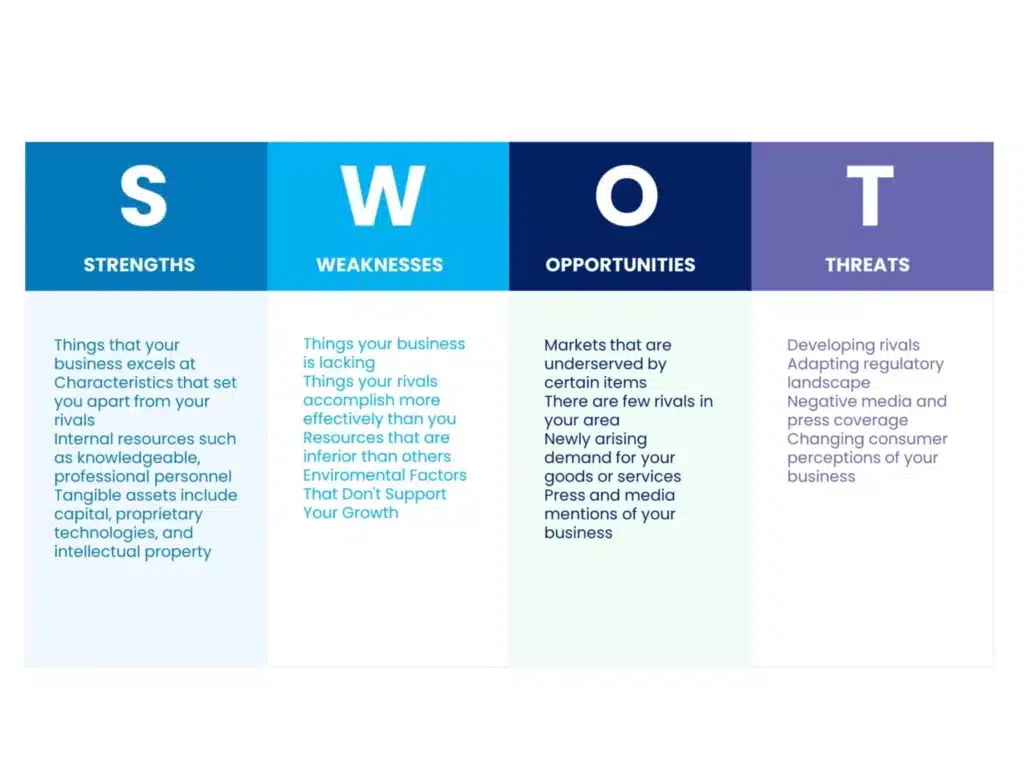
What Is a SWOT Analysis?
A SWOT analysis is typically a 2×2 grid that documents the Strengths, Weaknesses, Opportunities, and Threats of a given scenario or idea — concisely, but in enough detail to be useful. This grid is often called a SWOT matrix or chart.
It is fundamentally a planning tool that identifies a company’s strengths, weaknesses, opportunities, and threats by examining the internal and external factors affecting its structure and growth. In business terms, it’s a structured way to compare what a company controls against what the market controls.
A good analysis incorporates visual elements — charts, infographics, graphs, or diagrams — to make each quadrant easier to scan and explain. (SlideUpLift’s SWOT analysis PowerPoint templates give you that visual structure out of the box.)
The framework helps you assess a business’s core strengths and competencies, audit the assets and skills you can use to gain a competitive edge, and surface the weaknesses that may be holding you back. It also helps you track new developments in the market or technology that represent growth opportunities, while flagging risks before they escalate into bigger problems.
In one line: it’s a snapshot of where a business stands today, internally and externally, used to inform where it should go next. The core purpose is decision-making, not documentation — an analysis that’s only filed away never actually changes anything. What matters is less the four boxes themselves and more what you do with what’s inside them.
Why Is a SWOT Analysis Important?
A well-executed SWOT analysis is instrumental in guiding strategic planning and informing an organization’s direction. The two go hand in hand — most strategic plans start here, because you can’t set realistic goals without first knowing where you stand. By laying out internal strengths and weaknesses alongside external opportunities and threats, it gives decision-makers a comprehensive view of the business landscape — letting them lean into strengths and opportunities while addressing weaknesses and mitigating threats.
It also supports organizational alignment. When everyone on a team understands the strategic landscape, they can work toward common goals more efficiently. Revisiting and updating your analysis regularly keeps your strategy relevant as market conditions shift.
Specific benefits include:
- Boosts strategic planning: Helps you make well-informed decisions, leverage strengths and opportunities, and chart a course toward long-term success.
- Improves decision-making: Helps you prioritize initiatives, allocate resources effectively, and select the strategies most likely to achieve your goals.
- Identifies strengths: Knowing your core advantages — including a loyal customer base — makes it easier to set growth targets and pursue broader markets.
- Identifies weaknesses: You can only fix what you know about. Addressing weaknesses improves overall performance and efficiency.
- Highlights opportunities: Surfaces emerging trends and market openings that match your internal capabilities, helping you expand your market presence.
- Supports risk management: Proactively identifying threats like market saturation or changing regulations means you’re prepared for risk rather than reacting to it.
- Enhances communication and alignment: Gives stakeholders a shared, structured framework for discussing internal and external factors.
- Monitors performance: Used as a benchmarking tool, a regularly updated analysis helps you track changes and adapt strategy over time.
What Are the Four Parts of a SWOT Analysis?
The four parts are:
- Strengths: A business’s core strong points or competencies — the assets and skills you can use to gain a competitive edge.
- Weaknesses: Internal factors that interfere with an organization’s ability to deliver successful outcomes. Strengthening these areas is necessary to outperform competitors.
- Opportunities: External factors that might help you reach your objectives — new market developments, technologies, or business openings that support growth. They usually come from shifts you didn’t create but can still take advantage of.
- Threats: External risks and dangers that could endanger your development and success. They sit outside your direct control, so foreseeing and responding to them early is critical.
Strengths and weaknesses are internal; opportunities and threats are external. That internal/external split is the heart of the framework.
SWOT Analysis Example: ABC Electronics
To see the framework in action, let’s build one for a fictional company, ABC Electronics. Use it as a sample you can adapt — one way to structure the exercise, not the only way. The same approach works whether you’re evaluating a startup or an enterprise. (For more worked cases across business, competitor, project, and customer scenarios, see our roundup of SWOT analysis examples with templates.)
Strengths
- Established brand: A strong reputation known for quality and reliability.
- Innovative products: Consistent product launches that cater to evolving consumer needs.
- Advanced technology: Investment in cutting-edge technology gives the company a competitive edge.
- Skilled workforce: Talented teams across product design, manufacturing, and marketing.
Weaknesses
- High production costs: The manufacturing process drives up costs and pressures margins.
- Limited market share: Stiff competition keeps ABC Electronics’ share relatively small versus industry leaders.
- Dependence on suppliers: Heavy reliance on a few key suppliers creates vulnerability to disruption.
- Lack of retail presence: A thin retail footprint limits direct reach to customers.
Opportunities
- Emerging markets: Growing consumer demand for electronics in new regions.
- Strategic partnerships: Partnering with other tech companies or retailers to expand reach and distribution.
- Product diversification: New or adjacent product lines to diversify revenue streams.
- E-commerce expansion: Investment in online platforms to improve accessibility and global reach.
Threats
- Intense competition: A highly competitive industry with both established players and new entrants.
- Rapid technological change: Fast-moving innovation can make existing products obsolete.
- Supply chain disruptions: Natural disasters, geopolitical tensions, or other shocks can disrupt production.
- Regulatory changes: New manufacturing, safety, or trade regulations can raise compliance costs.
Types of SWOT Analysis
The framework adapts to almost any scenario. The most common types include:
1. Personal SWOT Analysis:
Assess your skills, weaknesses, career opportunities, and competitive threats to guide career planning — public speaking as a strength, say, or a skills gap as a weakness. (See our full guide to the personal SWOT analysis and ready-made personal SWOT templates.)
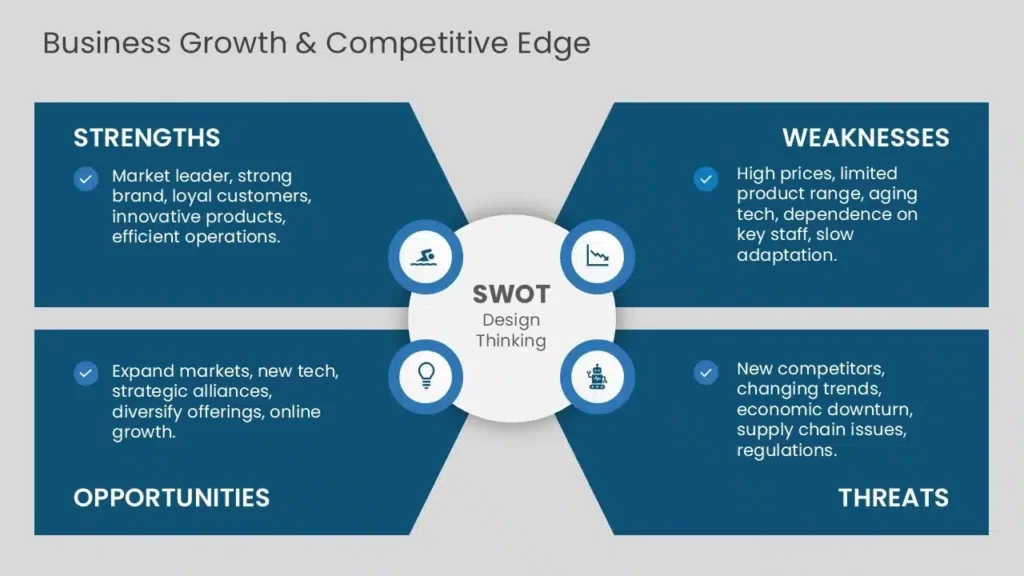
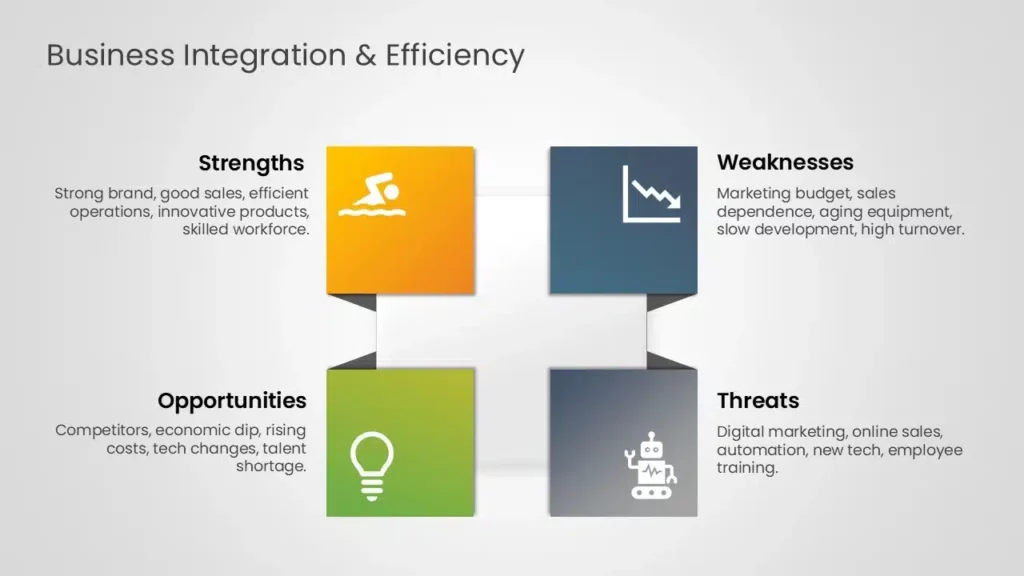
2. Business SWOT Analysis:
Evaluate internal capabilities and the external environment to inform strategy, marketing, and product development.
3. Project SWOT Analysis:
Assess a project’s feasibility, risks, and potential for success.
4. Product SWOT Analysis:
Understand a product’s market positioning and where it can improve or grow.
5. Environmental SWOT Analysis:
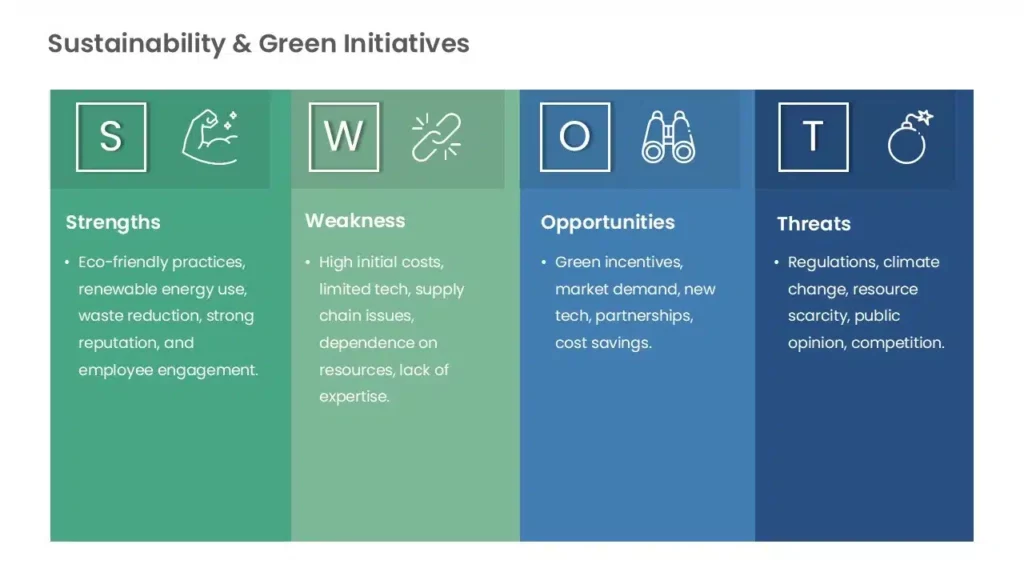
Assess ecological strengths and risks to support sustainability and regulatory compliance.
6. Strategic SWOT Analysis:
Guide long-term planning by aligning goals with market conditions.
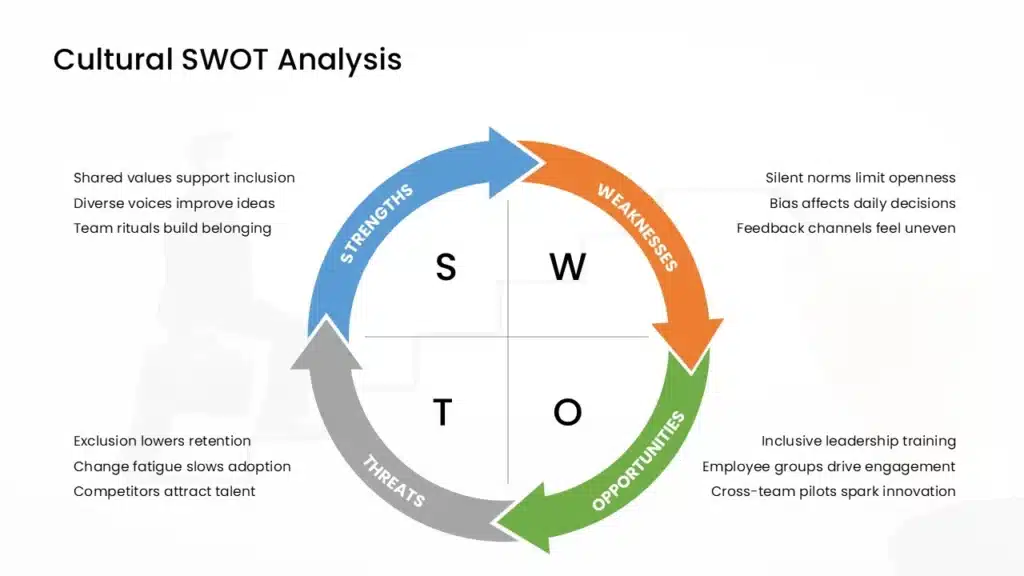
7. Cultural SWOT Analysis:
Examine organizational culture to improve inclusivity, engagement, and innovation.
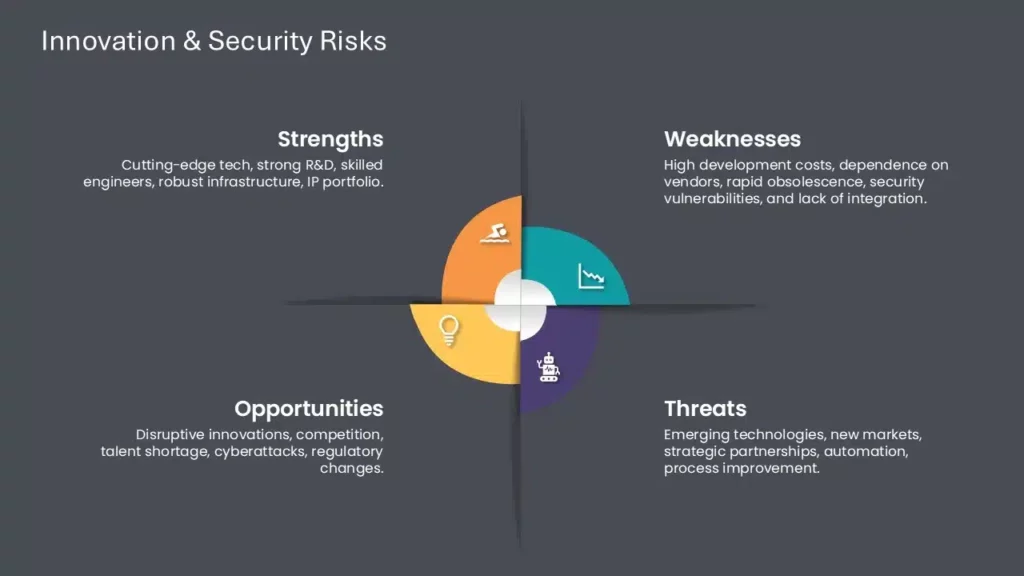
8. Technology SWOT Analysis:
Assess an organization’s tech capabilities, gaps, and innovation opportunities.
9. Customer SWOT Analysis:
Evaluate customer-related factors to improve satisfaction, loyalty, and retention.
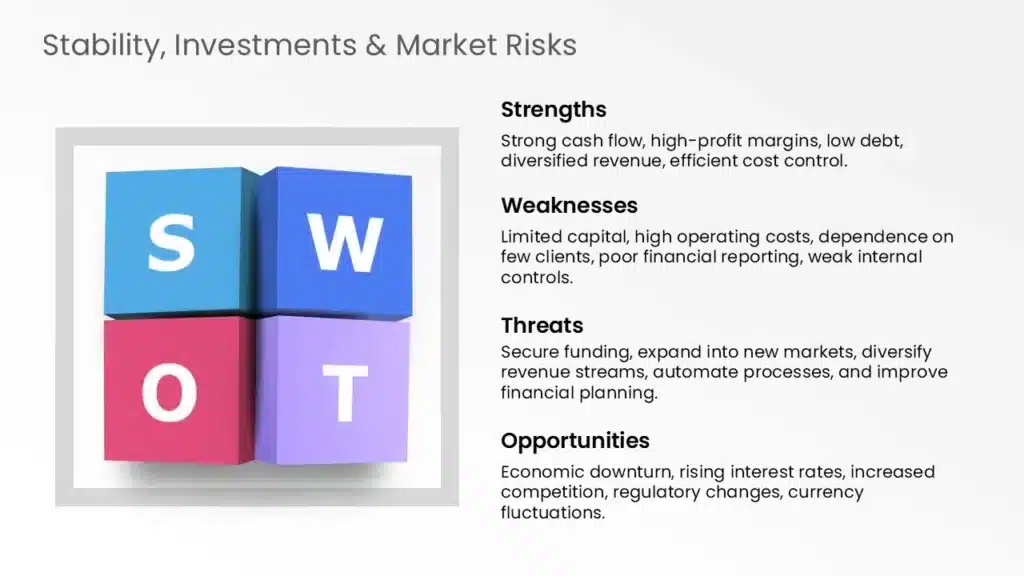
10. Financial SWOT Analysis:
Examine financial health, including cash flow risks and growth opportunities.
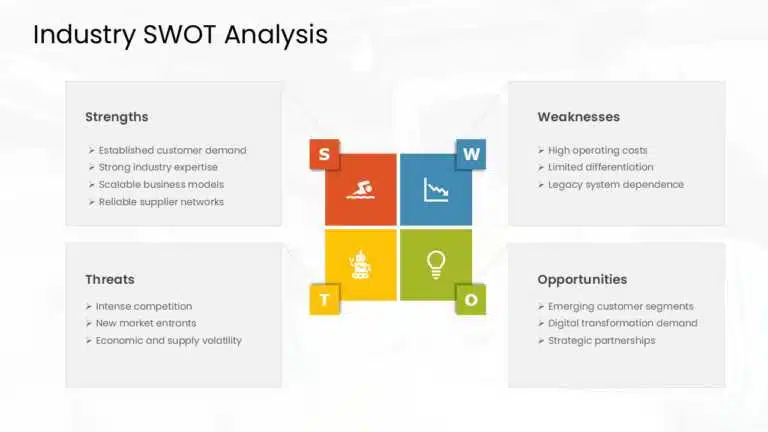
11. Industry SWOT Analysis:
Evaluate trends and competitive dynamics within a specific industry.
12. Cross-functional SWOT Analysis:
Assess factors across departments to promote collaboration and joint innovation.
13. Global SWOT Analysis:
Evaluate strengths, weaknesses, opportunities, and threats across international markets.
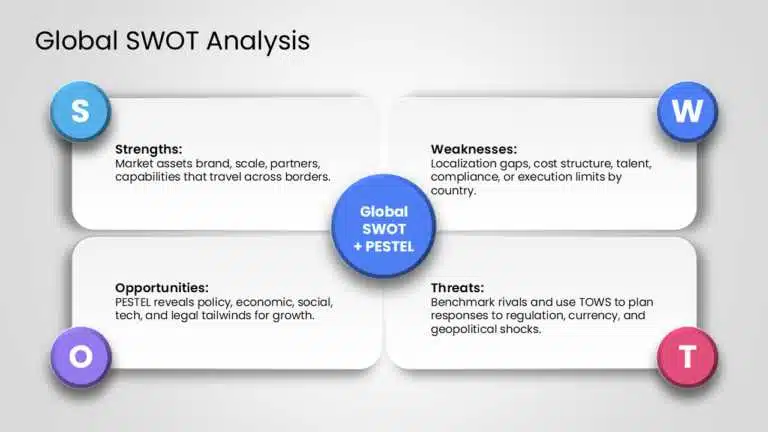
Beyond these, teams sometimes pair the framework with PESTEL analysis to capture macro-environmental factors a standard SWOT might miss. PESTEL is the most common companion, and the two tend to work best together rather than as substitutes. Other variations worth knowing about blend SWOT with TOWS or competitive benchmarking.
Who Needs a SWOT Analysis?
- Corporate professionals: For personal development and career planning.
- Businesses: To evaluate internal capabilities and the external environment and guide strategy and product decisions — marketing teams especially rely on it to plan campaigns around real strengths and gaps.
- Project managers: To assess feasibility, risks, and the factors likely to influence a project’s outcome.
- Investors: To evaluate potential investments and make more strategic capital-allocation decisions.
How to Conduct a SWOT Analysis
However you phrase it — do, write, or create — the process is the same. Before building yours, you need a solid understanding of your business and the market it operates in. That starts with separating internal and external factors.
Internal Factors
Internal factors are within the company’s control — strengths and weaknesses fall here. They typically include human resources, operations, financials, and assets. Examine the company closely: what are you doing well, what’s your strongest asset, and where are you underperforming?
External Factors
External factors sit outside the company’s direct control — a new regulation or a shift in market trends, for example. Opportunities and threats fall under this category. Research market trends and run a competitor analysis to identify the external threats most relevant to your business.
Document Your Findings in a Structured Format
- Organize your findings: Classify them into relevant categories so internal and external factors can be reviewed together, not just sorted into the four buckets.
- Prioritize key insights: Not every finding is a dealbreaker. Prioritize by criticality — especially issues flagged by senior leadership, such as brand-reputation risks or new competitive threats. Acting on weaknesses matters just as much as celebrating strengths; exciting opportunities like entering new markets are easy to rally around, but unresolved weaknesses quietly undercut them.
- Focus on connections: Draw links between findings — using a technological strength to capture a market opportunity, say, or a strong team to capitalize on emerging trends.
- Develop actionable strategies: Translate inferences into action plans using tools like 30-60-90 day plans, 120-day plans, OKRs, or roadmaps and timelines.
Presenting your findings in a structured, clear format is what turns the analysis into something genuinely actionable.
SWOT Analysis: Pros and Cons
Understanding the strengths and limitations of the framework helps you use it more effectively and set realistic expectations before you rely on it for a major decision.
Pros
- Simplicity and ease of use: Straightforward and accessible to businesses of any size, helping teams quickly identify key factors and reach holistic solutions.
- Comprehensive overview: Captures internal and external factors at a glance, supporting better decisions and reducing errors and delays — provided it’s documented carefully.
- Encourages collaboration: Like any brainstorming tool, it draws on input from different teams, leading to more diverse perspectives and innovative ideas.
- Identifies opportunities and risks: Spotting opportunities supports timely, profit-driving decisions, while spotting threats triggers proactive risk management.
- Flexible and cost-effective: Can be applied to virtually any problem, challenge, or scenario.
Cons
- Subjectivity and bias: Participants can be biased when documenting weaknesses and threats; overemphasizing strengths can undermine credibility.
- Lack of prioritization: Findings are often listed by relevance rather than priority, risking a missed focus on what matters most.
- Static nature: It’s a snapshot in time. Without regular updates, it quickly becomes outdated.
- Over-simplification: Reducing complex factors to bullet points can cause you to miss critical nuances or interdependencies.
- No built-in action plan: It’s a brainstorming tool, not an action plan. You’ll need additional frameworks — like OKRs, roadmaps, or 30-60-90 day plans — to turn insights into execution.
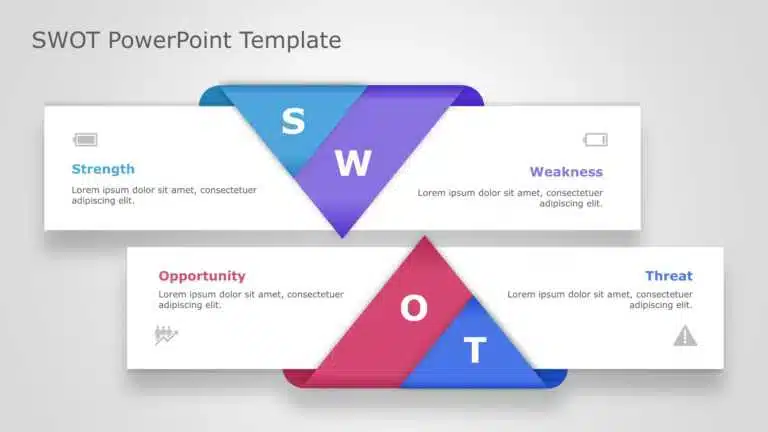
How to Make a SWOT Analysis in PowerPoint
- Open PowerPoint and create a new presentation.
- Go to the “Insert” tab and click “SmartArt” in the Illustrations section.
- In the SmartArt dialog box, open the “Matrix” category and choose a layout that fits your needs.
- Click into each SmartArt element to add your content, labeling the four boxes Strengths, Weaknesses, Opportunities, and Threats.
- Customize the design, then save and present once you’re satisfied.
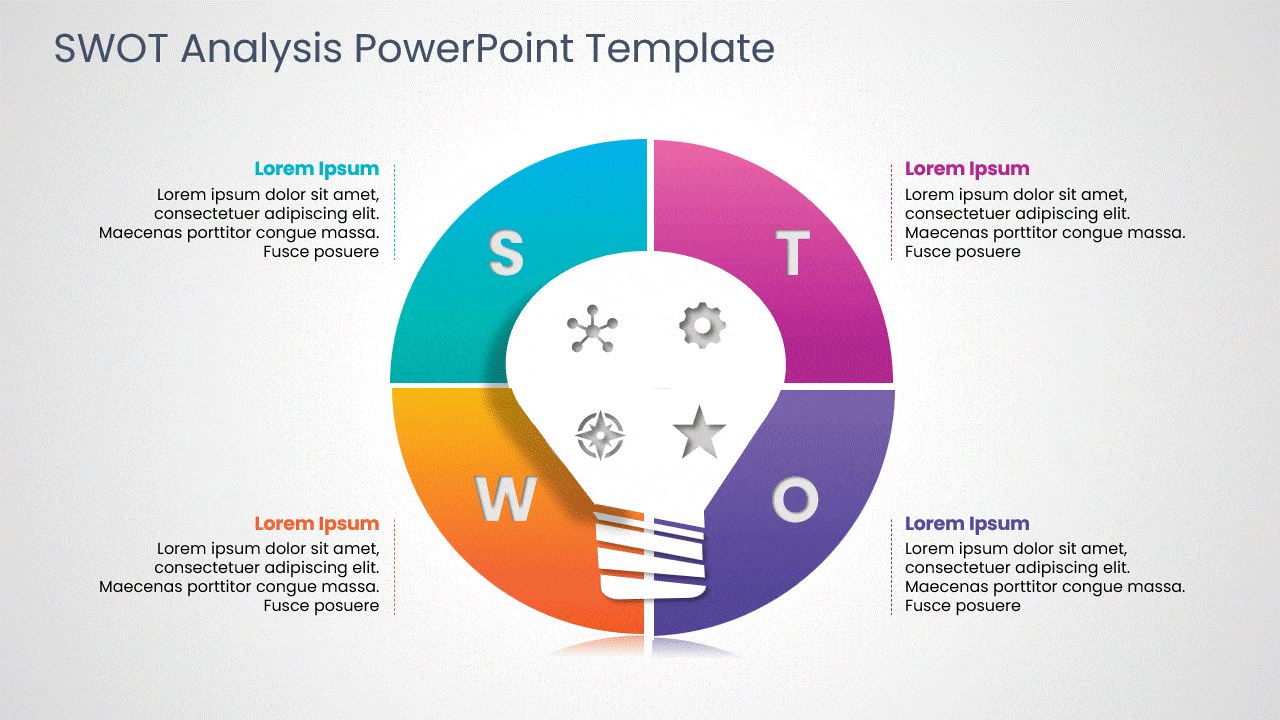
- Or skip the setup entirely and download a ready-made SWOT analysis PowerPoint template from SlideUpLift — including infographic and hexagon layouts.
How to Present a SWOT Analysis
Once your analysis is built, how you present it determines whether it actually drives decisions. Start with your objectives, then walk through strengths, weaknesses, opportunities, and threats in separate, clearly labeled sections.
A few practices consistently make these presentations more effective:
Structure first: Guide your audience through each quadrant in a logical flow, and back up key points with real data rather than assumptions.
- Use strong visuals: Charts, infographics, and a clean matrix make complex information easier to absorb than dense text or long bullet lists. A SWOT infographic template does this for you.
- Ground it in case studies: Real-world examples add credibility and help the audience see how findings translate to action.
- Close with strategy: End each section with a recommendation — how to build on a strength, fix a weakness, capture an opportunity, or mitigate a threat.
- Practice the delivery: Rehearse, focus on pacing and clarity, and consider recording yourself or running a mock presentation to catch issues with body language or timing.
- Make it interactive: Build in time for questions after each section, and consider live polls or quick quizzes to keep the audience engaged.
A successful presentation doesn’t just inform your audience — it gives them a clear reason to act on what you’ve found.
SWOT Analysis Templates
Building a presentation from scratch can be time-consuming, especially for busy professionals. SlideUpLift offers customizable SWOT analysis templates across multiple formats and industries, including:
- Business SWOT Analysis Template
- Product SWOT Analysis Template
- Project Team SWOT Analysis Template
- HR SWOT Analysis Template
- Strategic SWOT Analysis Template
- Personal and Individual SWOT Analysis Templates
If you’d rather not build the deck yourself, SlideUpLift’s presentation design services and AI Slide Editor can take you from raw findings to a polished, presentation-ready slide.
Now that you know what the framework is, why it matters, and how to conduct one, it’s time to run your own analysis and turn it into a presentation that drives real strategic decisions.
FAQs
-
What is a SWOT analysis?
It’s a strategic planning framework that evaluates an organization’s Strengths, Weaknesses, Opportunities, and Threats. Strengths and weaknesses are internal factors a business controls; opportunities and threats come from the external market environment.
-
What are the four parts of a SWOT analysis?
The four parts are Strengths (core competencies), Weaknesses (internal limitations), Opportunities (favorable external factors), and Threats (external risks). Together they give a complete picture of an organization’s strategic position.
-
How do I conduct a SWOT analysis?
Start by separating internal factors (strengths and weaknesses) from external factors (opportunities and threats). Gather data on each, organize your findings, prioritize the most critical insights, and translate them into actionable strategies, such as a 30-60-90 day plan or a roadmap.
-
What are the best practices for a compelling SWOT analysis presentation?
Use a clear, logical structure that walks through each quadrant separately, support claims with real data, and lean on visuals like charts and a clean matrix rather than dense text. Close each section with a specific, actionable recommendation, and build in time for audience questions.
-
Where can I find SWOT analysis templates?
SlideUpLift offers free and premium SWOT analysis templates for business, product, project, HR, and strategic use cases, available as editable PowerPoint and Google Slides files.
-
What are the limitations of a SWOT analysis?
It can be subjective, doesn’t inherently prioritize findings, becomes outdated quickly without regular updates, and doesn’t produce an action plan on its own. It works best alongside frameworks like OKRs or roadmaps that turn insights into execution.
Table Of Content


Related posts from the same category

27 Dec, 2023 | SlideUpLift
How to Explain SWOT Analysis in Presentation?
Research has shown that 85% of people are more likely to buy what you are saying if presented with visual content in the form of a presentation. PowerPoint presentations have

5 Mar, 2024 | SlideUpLift
SWOT Analysis Examples: Real-World Examples for Business, Projects & Products
The fastest way to understand a SWOT analysis is to see completed ones. Below are five detailed SWOT examples — two well-known companies, a small business, a project, and a

17 Apr, 2025 | SlideUpLift
Personal SWOT Analysis: A Comprehensive Guide With Examples and Templates
Key Highlights A personal SWOT analysis is a great way to understand yourself better and grow. It helps you identify your strengths, weaknesses, opportunities, and threats. This tool gives you

25 Jul, 2023 | SlideUpLift
How to Create a SWOT Analysis Presentation in PowerPoint and Google Slides?
Creating SWOT in PowerPoint and Google Slides is much easier than it looks. SWOT analysis is an effective tool that can be applied across various domains and is necessary for

6 Nov, 2024 | SlideUpLift
The Ultimate Guide to Creating A 30 60 90 Day Plan
Creating an effective 30-60-90 day plan is a valuable tool for both managers and employees to ensure a smooth transition into a new role within a company. This structured approach

27 May, 2025 | SlideUpLift
How to Create a Roadmap Diagram in PowerPoint? (Step-by-Step Guide)
Need to build a professional roadmap slide for your next presentation? You are in the right place. This tutorial walks you through every method for creating a roadmap diagram in

25 Apr, 2025 | SlideUpLift
C-Suite Mastery: Guide to High-Stakes Executive Presentations
C-level presentations are pivotal—not just for business outcomes, but for making your voice count where it matters most. Executives steer the company’s direction, and the insights you share often influence

11 Sep, 2023 | SlideUpLift
Complete Guide to Outsourcing PowerPoint Presentations
The importance of compelling presentations cannot be emphasized. They serve as channels for exchanging knowledge, influencing choices, and communicating ideas. A well-designed presentation can influence perceptions, motivate action, and boost

4 Mar, 2024 | SlideUpLift
What Are The Five Whys? 5 Whys Root Cause Analysis Explained!
Have you ever encountered never-ending problems in your professional or personal lives? In their problem-solving and continuous improvement journey, organizations find challenges that require intensive research to reach their root

24 Mar, 2023 | SlideUpLift
SOAR Analysis: Make Strategic and Impactful Business Decisions
Have you ever found yourself at a crossroads in your business, wondering which direction to take? You may have faced a tough decision, but you're still determining which option will significantly