Product Description:
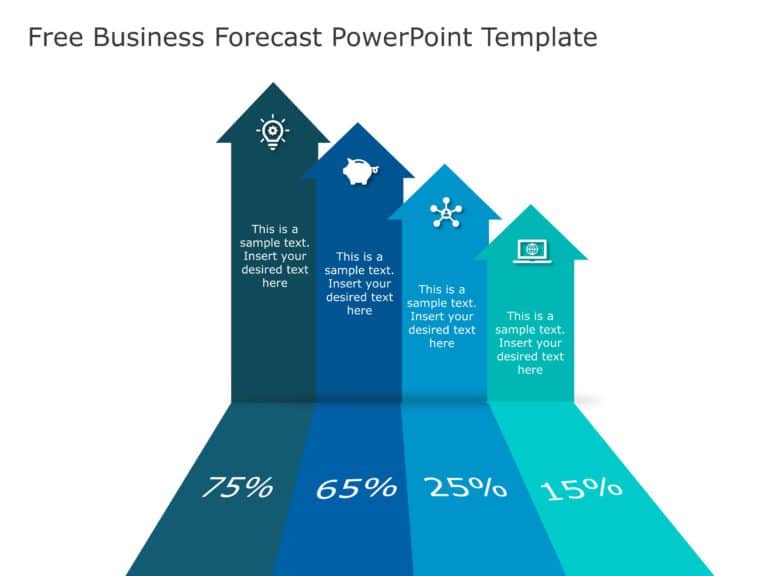
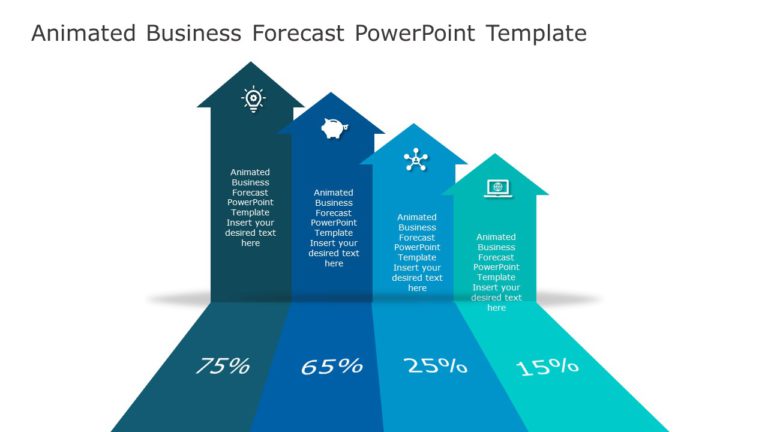
Use this template to compare actual results in comparison to projected or forecasted performance. It can be used to visualize and analyze revenue, sales or profit data in an easy to understand manner. It helps professionals logical and informed decisions.
This green-themed PowerPoint template features a line graph rising from the left side to the right, conveying an increase or growth. Behind each key point on the line graph, a bar chart is placed. In addition to this, on the top left corner of this template, you are provided with an editable text box. This text box is divided into two parts, the forecast and the actual. You can effectively mention the highlights or key points of this analysis.
Such business slides can be used by sales, marketing or finance professionals to effectively present revenue data in a structured and organized manner. All elements of this template are 100% customizable. Moreover, it is compatible with Google Slides.


