Product Description:
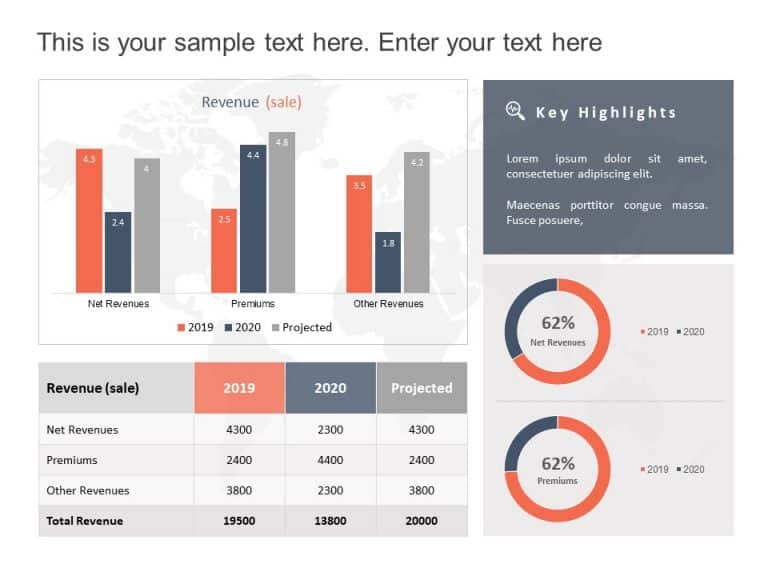
Designed for clarity and impact, this dynamic template enhances your presentations with a visually striking 3D bar graph that effectively showcases major cost drivers for the fiscal year. The sleek design features a modern color palette, making it perfect for corporate professionals who need to convey complex financial data in an easily digestible format.
Each bar represents a different source, clearly illustrating their contributions to overall costs, with percentages prominently displayed for quick reference. This layout is ideal for financial analysts, budget managers, and business strategists looking to present data-driven insights during meetings or reports.
The accompanying world map background adds a global perspective, making it suitable for international business discussions.
Elevate your financial presentations and ensure your audience grasps key information at a glance. Download now and transform your data into impactful visuals! Find more such 3D PowerPoint templates for engaging presentations. These templates are compatible with both PowerPoint and Google Slides.


