Product Description:
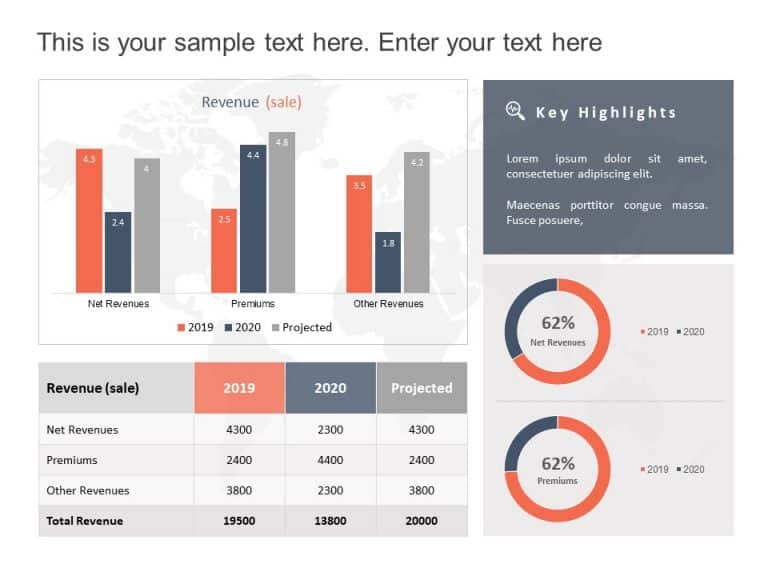
This comparison chart template is a way to illustrate your data effectively and engage your audience at the time! It’s perfect, for displaying sales trends. Includes a bell curve design that compares two products visually over a period of time. The simple layout makes it easy to emphasize metrics. Is well suited for marketing teams and business analysts aiming to deliver impactful insights, in meetings.
The format incorporates colors and clear borders for products to help your viewers easily distinguish performance variations. Additionally equipped with room, for bullet points, beneath the chart to succinctly outline your discoveries and reinforce your storyline.
Enhance your presentations with this template that helps you analyze product performance and discuss market trends effectively.Transform your data into stories that connect with your audience. Download ! Find more such Graphs & Charts PowerPoint templates for engaging presentations. These templates are compatible with both PowerPoint and Google Slides.


