Product Description:
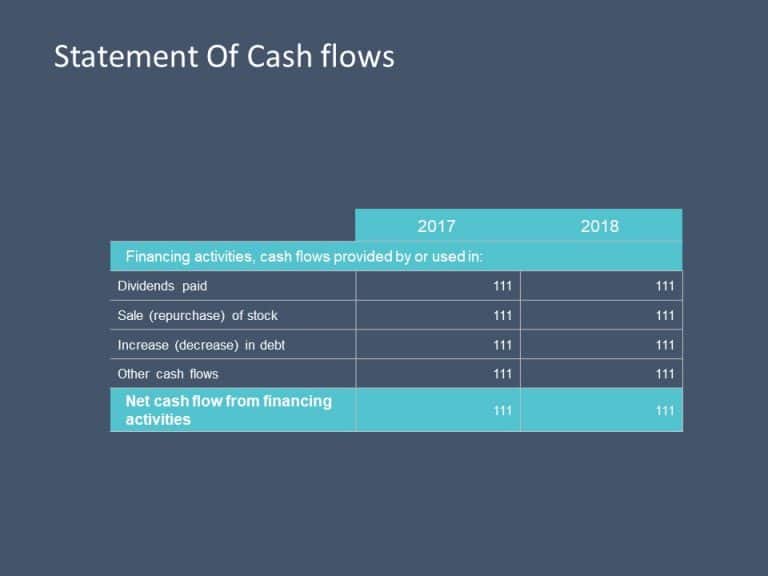
Enhance your meetings with a captivating waterfall chart tailored for analyzing cash flow and visually presenting shifts, in cash position across two time frames – ideal, for discussions and presentations.
With its distinctive chalkboard style layout and colorful design scheme to highlight shifts, in cash flow trends clearly and effectively – this template offers a blend of sophistication and practicality for presenting financial information in a digestible format that resonates well with corporate professionals, like financial analysts and business managers alike.
This template includes cash sections at the beginning of the year and covers cash from operations well as the impact of exchange rate fluctuations; it is designed for strategic conversations and financial assessments.
Get the app today. Turn your presentations into meaningful conversations that influence decision making! Find more such Data Visualization PowerPoint templates for engaging presentations. These templates are compatible with both PowerPoint and Google Slides.


