Product Description:
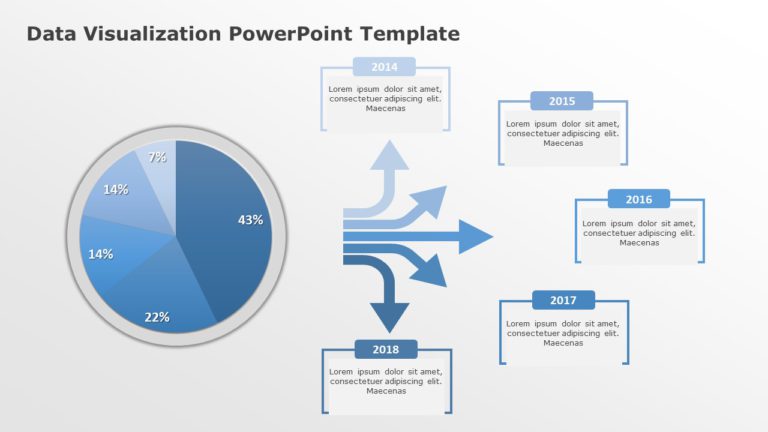
Share your ideas using this eye catching data visualization template that aims to highlight your data. The design of this slide includes an elegant arrangement, with a blend of orange and soft gray shades to craft a visually engaging presentation that grabs the viewers interest. The distinct circular infographic enables you to percentages in a manner making it ideal, for presenting important metrics or performance measures.
Designed for individuals, in the business field such as professionals, in business administration and marketing departments this format is well suited for creating reports or facilitating strategy discussions and evaluations of performance within a team setting.The user friendly layout aims to help your audience understand the content promptly and effectively; additionally you have the flexibility to adjust the elements according to your requirements.
Get it now. Turn your information into captivating graphics that effectively convey your message to the audience! Find more such Data Visualization PowerPoint templates for engaging presentations. These templates are compatible with both PowerPoint and Google Slides.


