Product Description:
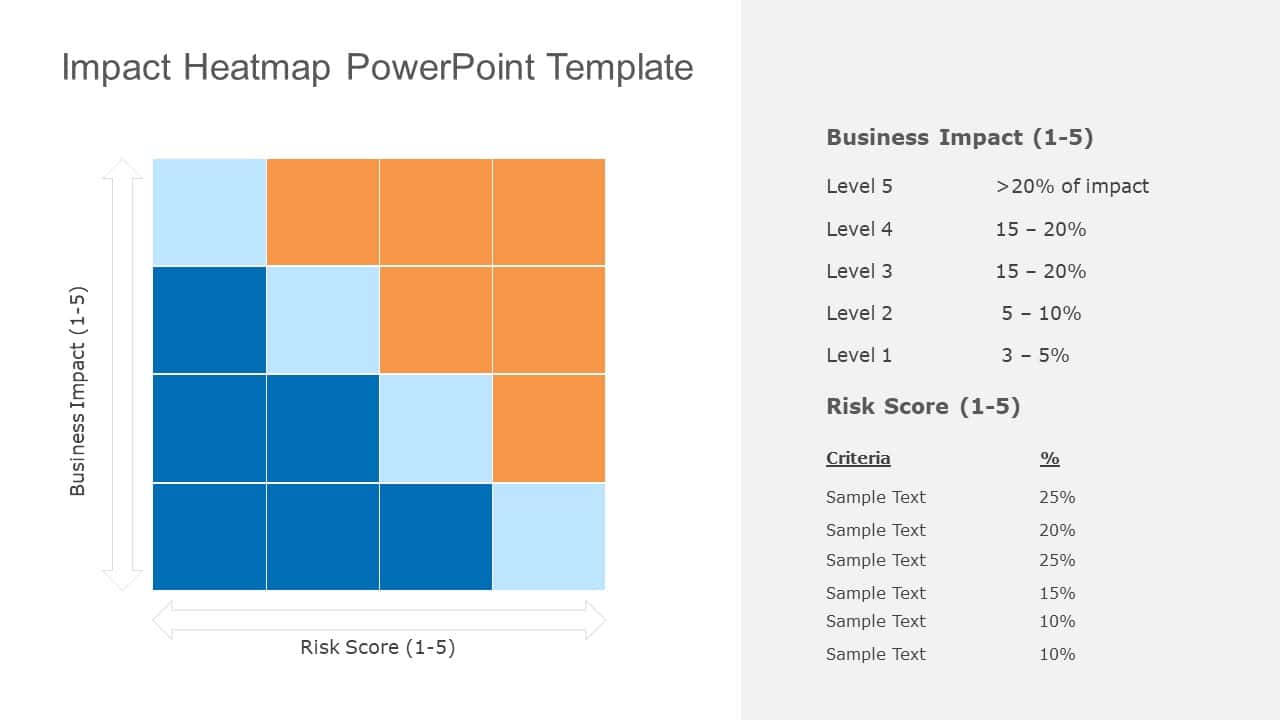
Easily break down concepts using this heatmap design made for illustrating business effects and risk evaluations with ease. This layout showcases a grid pattern that helps users organize and evaluate projects or plans according to their potential impact and related risks, in a straightforward manner. The diverse color palette – spanning from calming blues, to inviting oranges – not boosts attractiveness but also aids in quick data comprehension.
Great, for project managers and business analysts alike; this tool is excellent, for planning meetings. Assessing risks while also evaluating performance effectively.The section outlining criteria offers a method to measure risks in a manner so that your team can swiftly make well informed choices.
Get your hands on this crafted template today. Turn your data into valuable insights, in no time! Find more such PowerPoint Map templates for engaging presentations. These templates are compatible with both PowerPoint and Google Slides.


