Flat 4

 Edit with AI
 Ask Us To Edit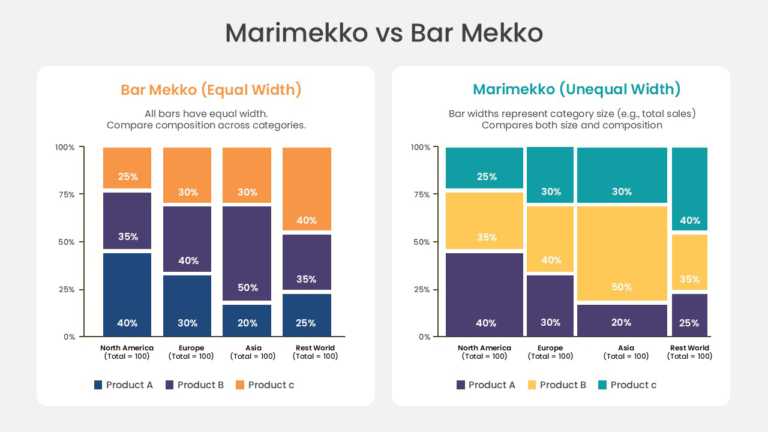

Product Description:
The Marimekko and Bar Mekko Chart PowerPoint And Google Slides Template helps users compare two stacked chart formats side by side across four category groups. It is suitable for sales teams, business analysts, and finance teams who need to communicate the difference between equal-width and proportional-width data visualization.
The slide features a title, “Marimekko vs Bar Mekko,” above two side-by-side chart panels. The left panel, “Bar Mekko (Equal Width),” shows four equal-width stacked columns for North America, Europe, Asia, and Rest World, each split into Product A, B, and C segments in navy, purple, and orange with percentage labels. The right panel, “Marimekko (Unequal Width),” shows the same four categories with variable-width columns reflecting total sales size, split into Product A, B, and C segments in navy, yellow, and teal. Both panels include a y-axis from 0% to 100%, category totals labeled below each column, and a color legend at the bottom. Explore more Chart PPT Templates for presenting sales data, market comparisons, and proportional breakdowns.
Compatible with: PowerPoint | Google Slides | Widescreen (16:9)