Product Description:
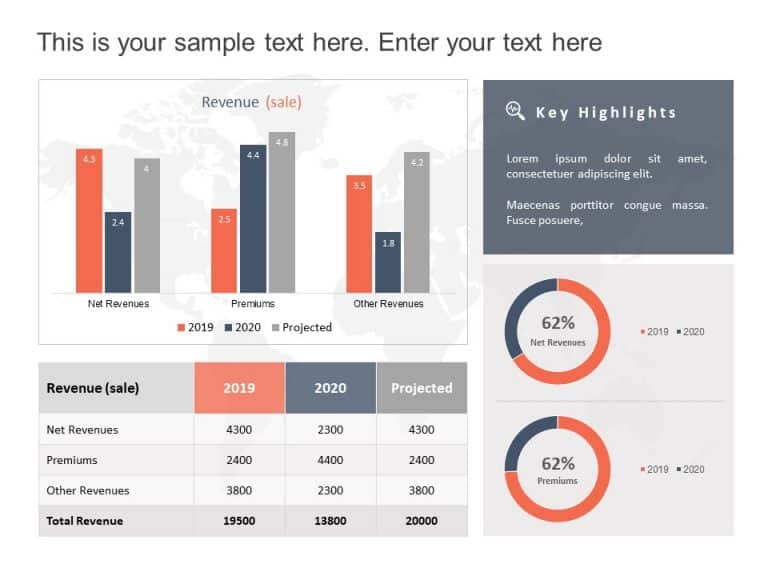
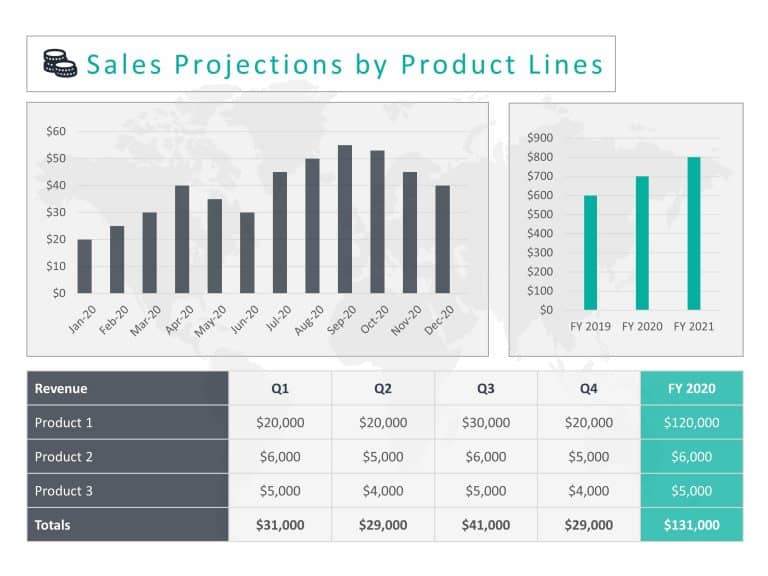
Enhance your presentations using this appealing bar chart template crafted to showcase expense discrepancies, ideal, for finance experts and project leaders aiming to highlight variations, between actual and projected figures in a clear and engaging manner.
The design layout is neat and organized with color distinctions – blue to show increases, in values and red to indicate decreases while gray represents values – enabling your audience to quickly understand the financial information presented on it at first glance. Using bar charts facilitates comparison among expense categories, like employee salaries, benefits and professional services.
Perfect for business meetings and financial discussions alike; this template simplifies the communication of information, with clarity and efficiency.
Get the app today. Turn your finance pitches into engaging narratives! Find more such Graphs & Charts PowerPoint templates for engaging presentations. These templates are compatible with both PowerPoint and Google Slides.


