 Fall Sale
 Flat 40% off on our Unlimited Access Yearly Membership plan!

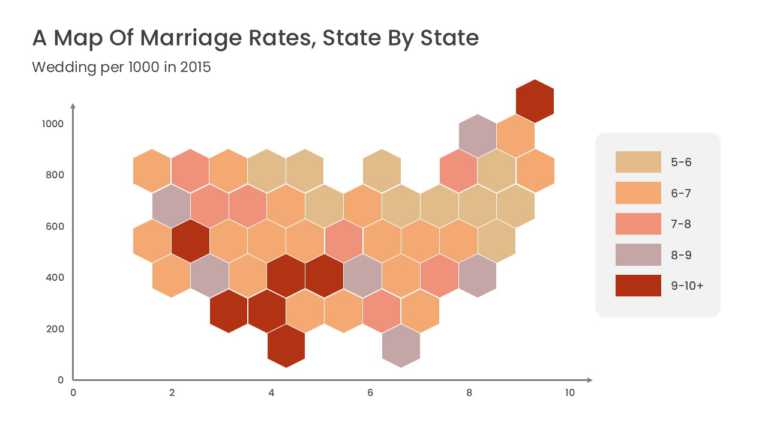
This US data map represents each state as a uniform hexagonal tile arranged in the approximate geographic layout of the country. Equal tile sizes....


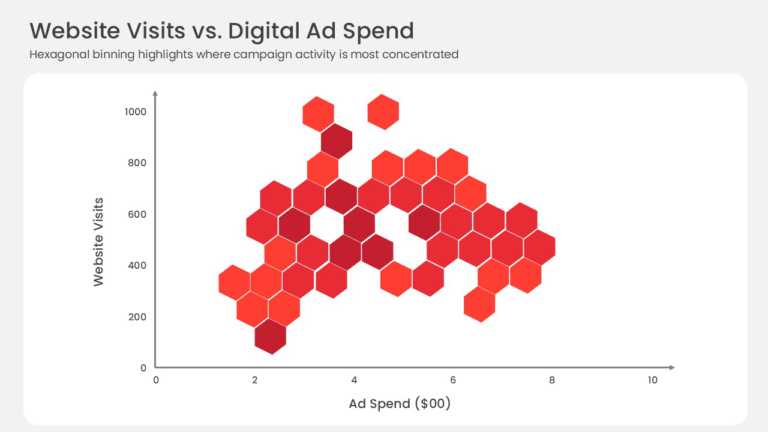
This hexbin scatter plot replaces individual data points with a grid of hexagonal bins plotted against X and Y axes. Color intensity indicates ho....
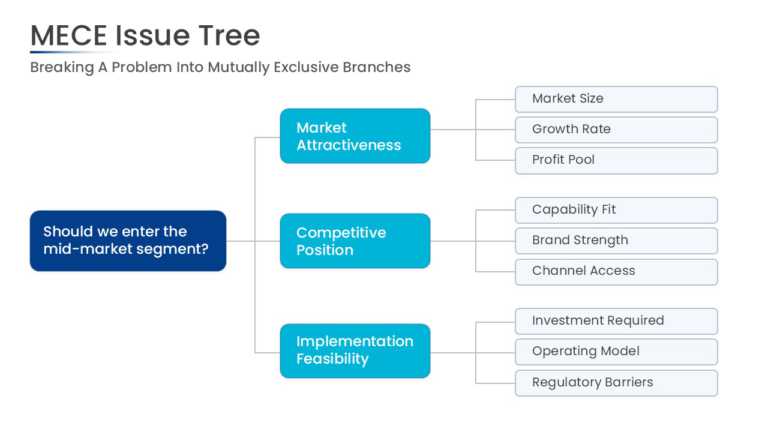
This MECE issue tree starts with a root problem statement on the left and splits it into 3 primary branches. Each branch extends into sub-issues,....
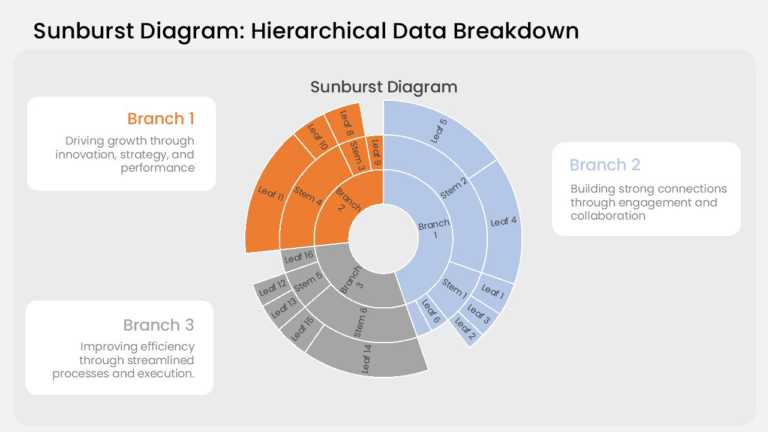
This sunburst chart arranges hierarchical data in three concentric rings. The inner ring holds the top-level categories, the middle ring breaks e....
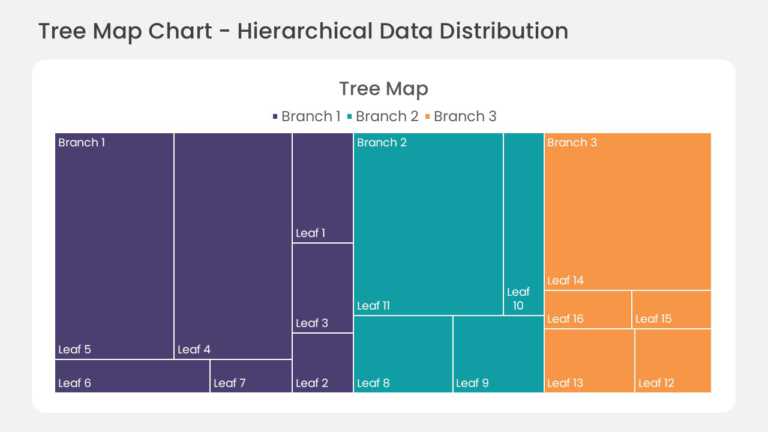
This hierarchical treemap chart divides the slide area into nested rectangles, with each rectangle sized by its share of the total value. Child s....

The 10 Step Customer Onboarding Workflow PowerPoint And Google Slides Template helps users present a structured customer onboarding journey from ....