Flat 4


 Edit with AI
 Ask Us To Edit

Product Description:
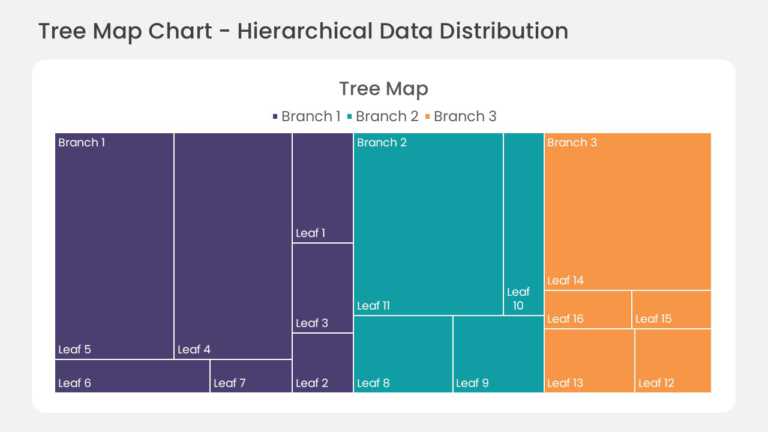
This hierarchical treemap chart divides the slide area into nested rectangles, with each rectangle sized by its share of the total value. Child segments sit inside their parent category blocks, so both the category split and the item-level split are visible in one frame. Text labels inside each tile carry segment names and values.
A Finance Manager or Business Analyst can use this chart in a quarterly budget review to show how spend or revenue breaks down across business units and their sub-categories. The nested layout makes the largest contributors stand out without a separate drill-down slide.
Browse more chart templates for data visualization, or read our guide on guide to chart types and their uses. This template is fully editable and compatible with PowerPoint and Google Slides.