Product Description:
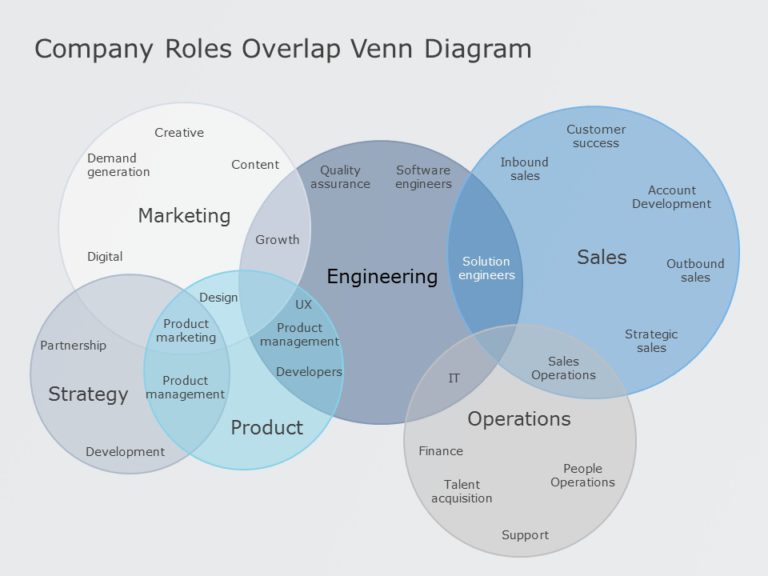
Enhance your presentation, with this captivating Venn diagram template tailored for showcasing data science insights. This striking slide showcases a layout that harmoniously merges colors to simplify complex information for quick comprehension. The interconnected circles spotlight ideas like Automation, Validity and Intuition ideal for depicting the connections and intersections, within data science approaches.
Great, for data analysts and educators alike! This template is ideal for talking about topics like machine learning and statistical analysis with ease and clarity, in both academic settings.
Explore the parts that focus on skills and methods, in this template to not just improve how you visually tell your story but also to keep your audience interested and involved.Download it now to take your data presentations to the level, with this flexible template! Find more such Visualization PowerPoint templates for engaging presentations. These templates are compatible with both PowerPoint and Google Slides.


