Product Description:
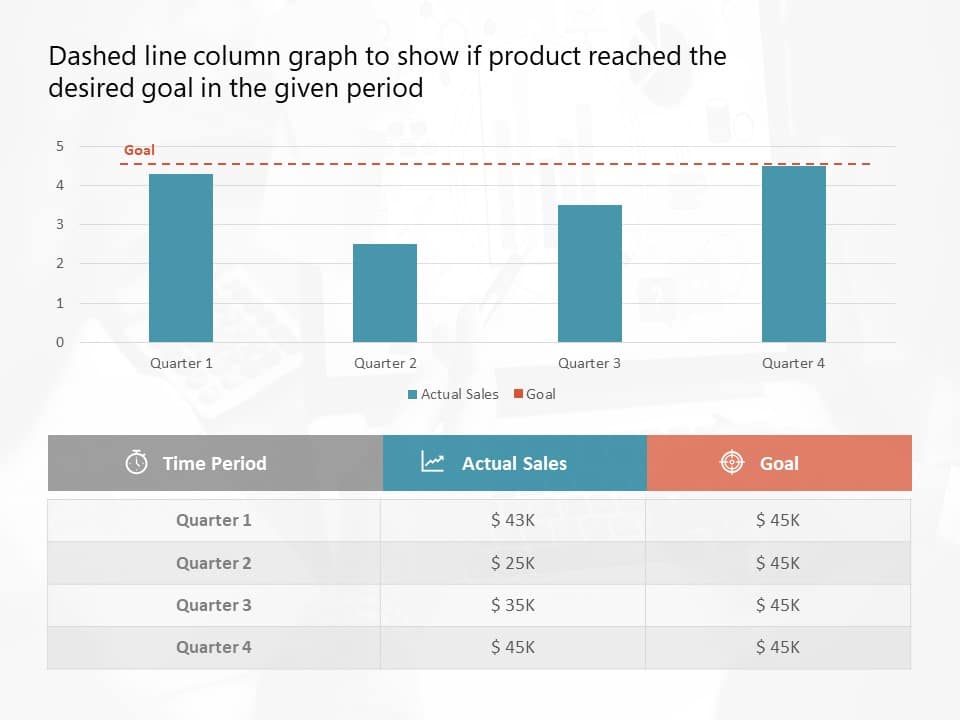
Present a story using this column chart layout crafted to display your sales progress throughout the years effectively; This slide displays a stylish dotted line graph that simplifies the comparison, between real sales figures and predefined targets, for every quarter. The neat design and lively color palette improve readability. Enable your viewers to understand details quickly with just one look.
Designed for sales teams and professionals, in the business world. This template is what you need for evaluations, performance reviews or strategic planning meetings! The included table breaks down sales numbers in an concise manner to present your data effectively.
Enhance your presentations by communicating your findings with this template whether you’re analyzing trends or setting future targets. Download now to elevate your work with this tool! Find more such Graphs & Charts PowerPoint templates for engaging presentations. These templates are compatible with both PowerPoint and Google Slides.


