Product Description:
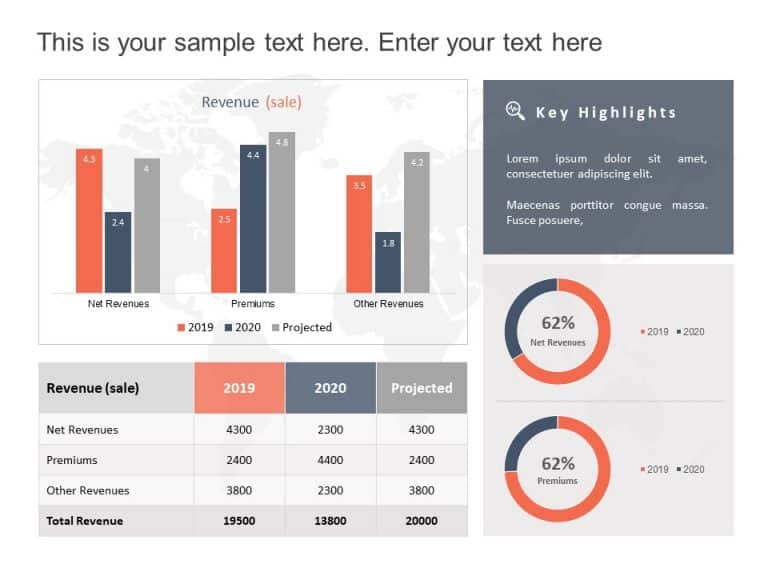
Show your stakeholders an eye catching line graph that effectively shows the trends, in profits across quarters in a manner with this template designed to simplify presenting intricate financial information. Ideal for corporate gatherings and financial assessments. The neat design showcases a blue line graph that lets your audience smoothly follow the changes, in profits from the quarter of 2014 to the first quarter of 2018.
The template not features a graph. Also provides essential financial metrics, like revenue numbers and new customer acquisitions along with gross profit and total costs figures that are clearly compared to previous values with percentage changes indicated. Making it a great tool, for finance experts and business analysts aiming to communicate crucial information efficiently.
Upgrade your reports with this templates design and user friendly layout that will engage your audience effectively. Grab it now to elevate your presentation game! Find more such Graphs & Charts PowerPoint templates for engaging presentations. These templates are compatible with both PowerPoint and Google Slides.


