Product Description:
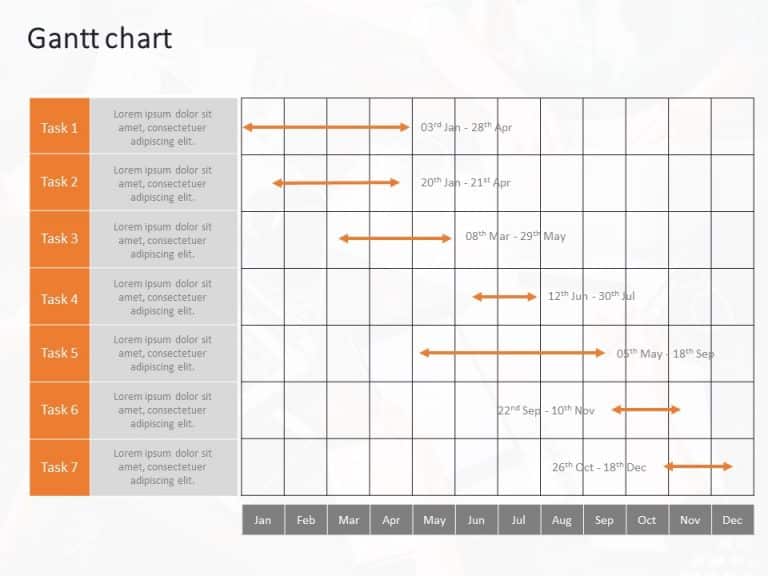
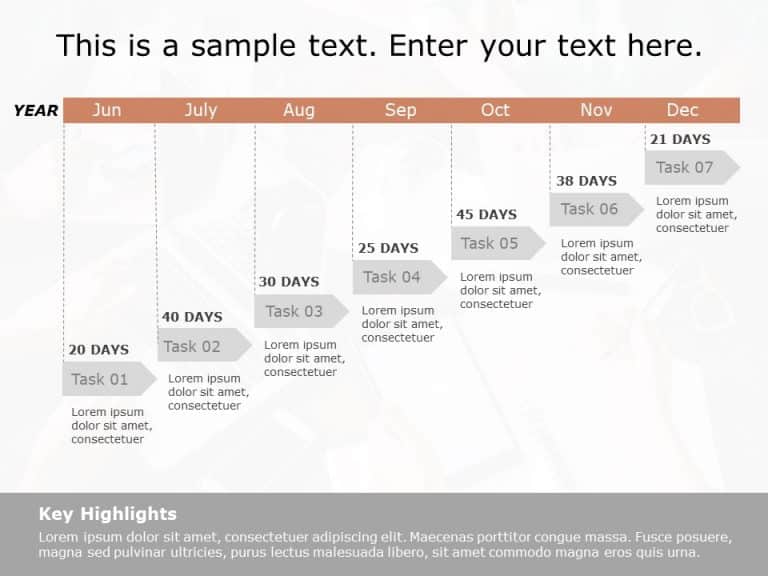
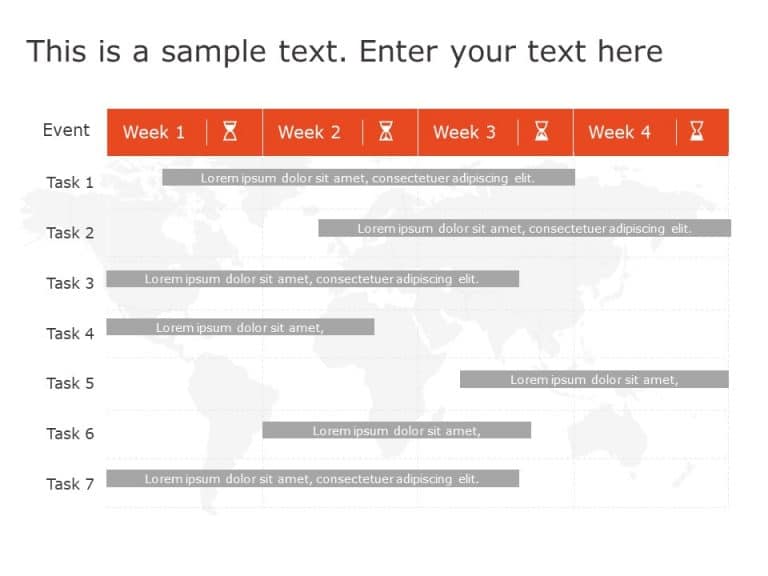
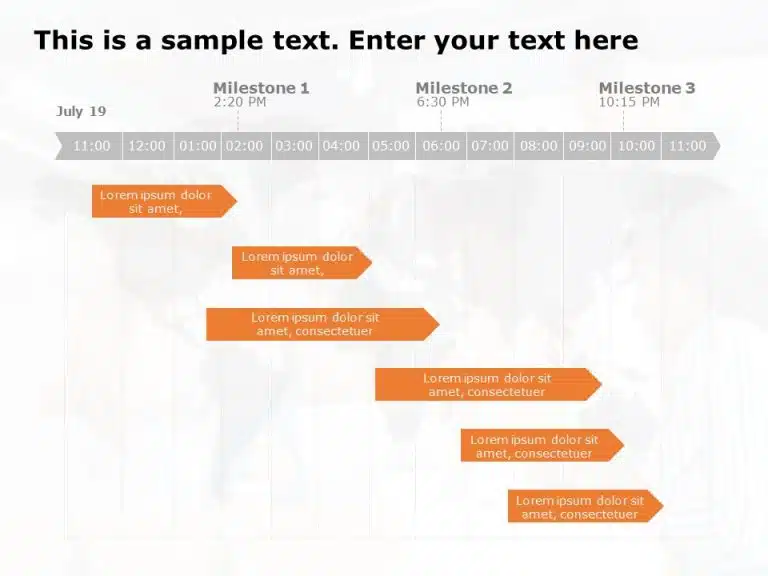
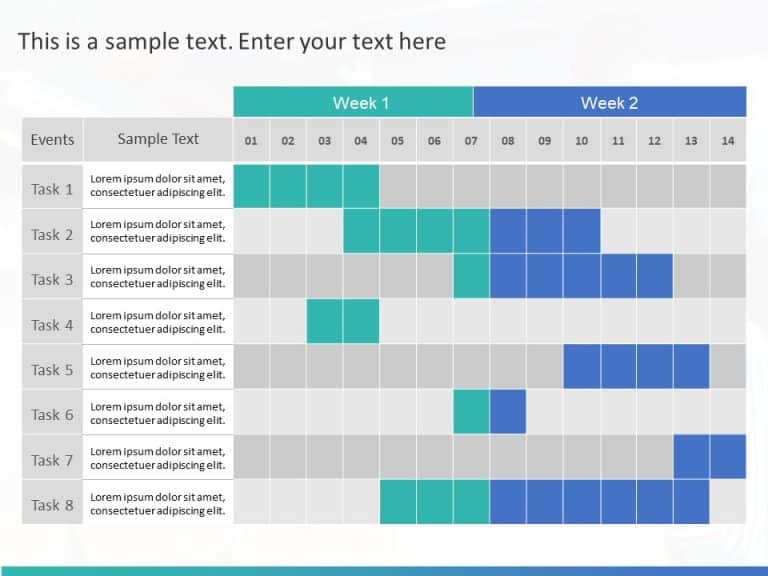
This free Gantt Chart Template has been created to display tasks clearly over time. This template helps individuals visualize the duration of a task. It also includes the start and end times of each task. It is a resource for organizing and monitoring projects.
The title Free Gantt Chart PowerPoint template is present at the top. The template is presented in chart form as a line graph. Below the title, there is a vertical display of 12 months. There are tasks mentioned on the left side of the template. Each task is accompanied by a timeline indicating its start and end dates. Different colors in the line graph distinguish completed days from the remaining days. The contrasting dark and light colors make it easy to differentiate between them. The background is dark in color, which is accompanied by a yellow ribbon that can be used to write additional information.
This business presentation template can benefit individuals involved in project management, event planning, or team collaboration. It aids in planning and provides stakeholders with a clear overview of the progress. It can be customized according to the requirements. Additionally, it is compatible with PowerPoint and Google Slides.


