Product Description:
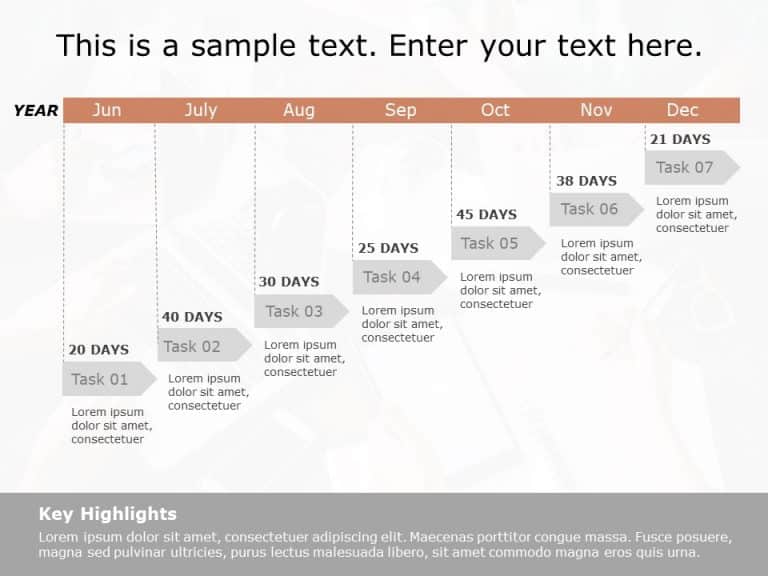
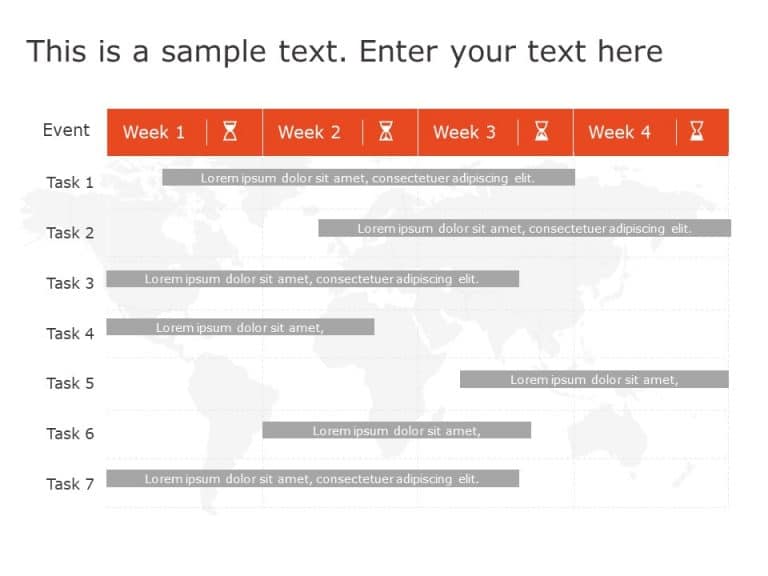
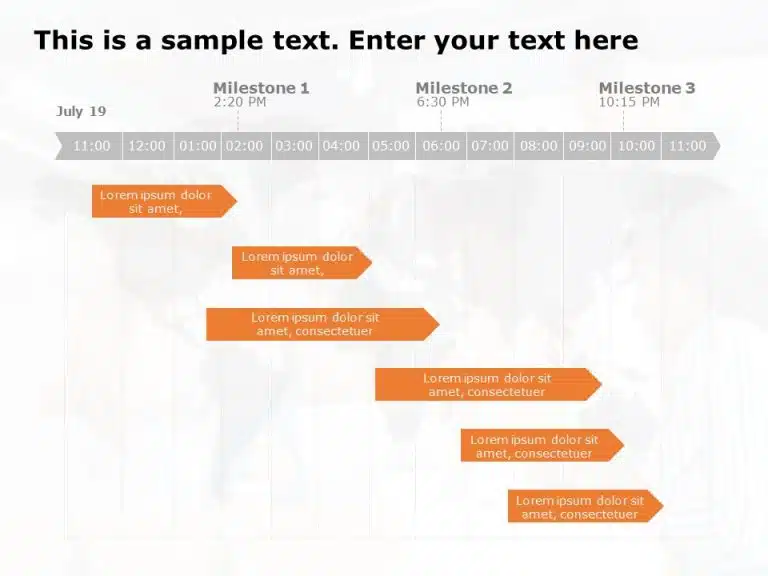
This Gantt chart template is a visual representation of a project’s schedule. It allows users to plan, track, and manage tasks over a specific period. The milestones help in tracking significant stages or achievements within the project timeline. It ensures that the project is progressing as planned.
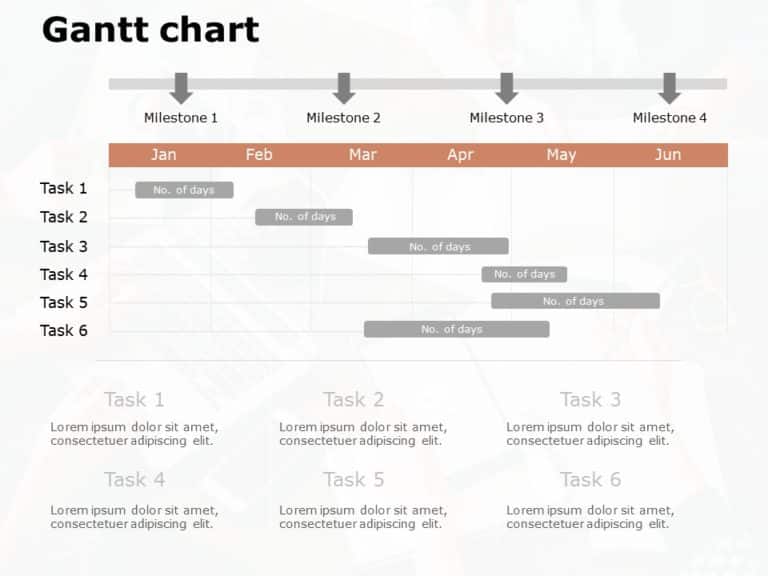
The PowerPoint Gantt Chart template has a header title displayed at the top. Six tasks are mentioned at the top, and four milestones at the top. Below are the milestones for the months from January to June. All the tasks are mentioned according to the number of days that will be required. The details of the tasks are highlighted at the bottom. The gray and brown color scheme portrays a professional look during the presentation.
Such business slides can be used by project managers to plan and monitor project timelines. Team Leaders assign tasks to team members and track their progress over time. Event Planners for planning events with multiple tasks and deadlines. This template can be customized according to the requirements. Additionally, it is compatible with PowerPoint and Google Slides.


