Product Description:
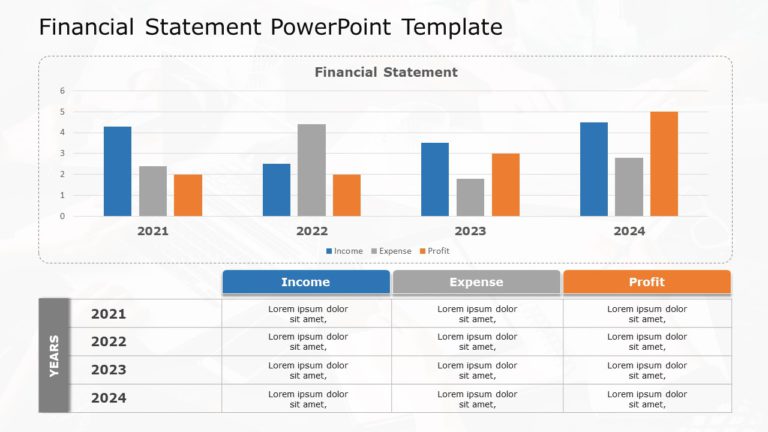
Enhance your presentations with this vibrant area chart template crafted to display your income and expenditures with impact. This captivating slide enables you to communicate information in a compelling and straightforward way. Ideal, for corporate meetings or financial assessments.
The layout showcases an appearance combining orange hues seamlessly to help viewers distinguish between income and costs effortlessly with just a quick look.The three dimensional illusion creates a sense of depth that accentuates your information and draws the eye.
Perfect for individuals, in finance roles or project management and anyone looking to communicate information this template makes it easy to understand intricate data in a clear and straightforward manner. Whether you’re examining trends across months or evaluating performance indicators side by side. This area chart will elevate your presentation. Support well informed decision making.
Get it today. Turn your presentations into powerful visual stories! Find more such Graphs & Charts PowerPoint templates for engaging presentations. These templates are compatible with both PowerPoint and Google Slides.


