Product Description:
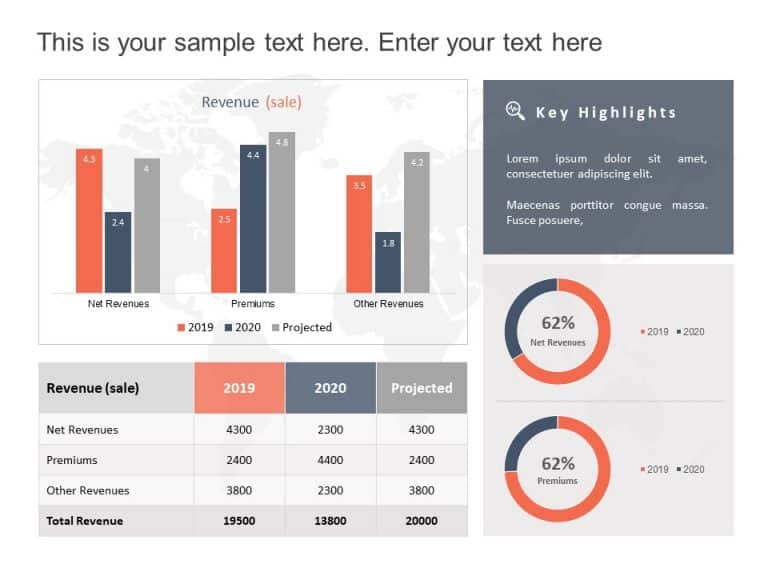
Craft compelling visual narratives using this captivating income bar graph template! Ideal, for presentations; this slide enables you to display your firms earnings and expenditures in a concise powerful manner. The elegant layout incorporates color schemes; deep blue bars symbolize revenues while vibrant orange bars signify expenses – simplifying the comprehension of financial data, in an instant.
Designed for business executives and professionals alike! This template is perfect, for analyzing budgets and financial projections or conducting performance assessments with ease and style, in mind! Its user friendly layout allows for seamless data input while keeping an appearance intact.The background features a keyboard design that adds a touch of professionalism without overshadowing the data at hand.
Enhance your presentations instantly by downloading this captivating template that transforms intricate data into engaging stories! Find more such Graphs & Charts PowerPoint templates for engaging presentations. These templates are compatible with both PowerPoint and Google Slides.


