Product Description:
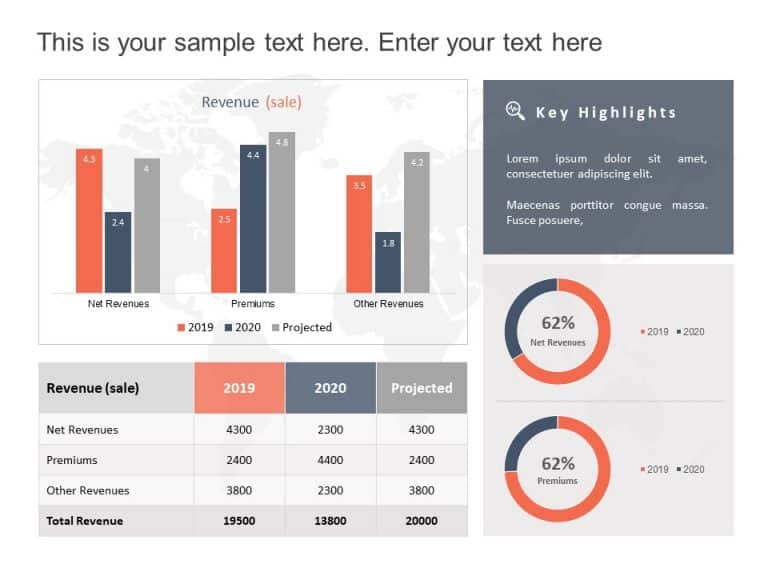
Engage your audience from the get go with this eye catching comparison chart template crafted for analyzing revenue and expenses visually appealingly designed in shades of blue tones, for showcasing crucial financial data from both 2020 and 2021. A great fit, for business executives and financial experts alike.
The design features bar graphs that make it easy to compare revenues and other income sources, with detailed expense breakdowns such, as salaries and claims data in a neatly arranged layout that presents your information clearly for everyone involved in the process.
Ideal, for meetings or financial discussions. Even when mapping out strategies‚Äîthis template doesn’t just elevate the visual aspect of your presentation but also helps communicate essential financial information effectively.
Enhance your presentations by downloading to spark interactive conversations that deliver impactful outcomes! Find more such Finance PowerPoint templates for engaging presentations. These templates are compatible with both PowerPoint and Google Slides.


