Product Description:
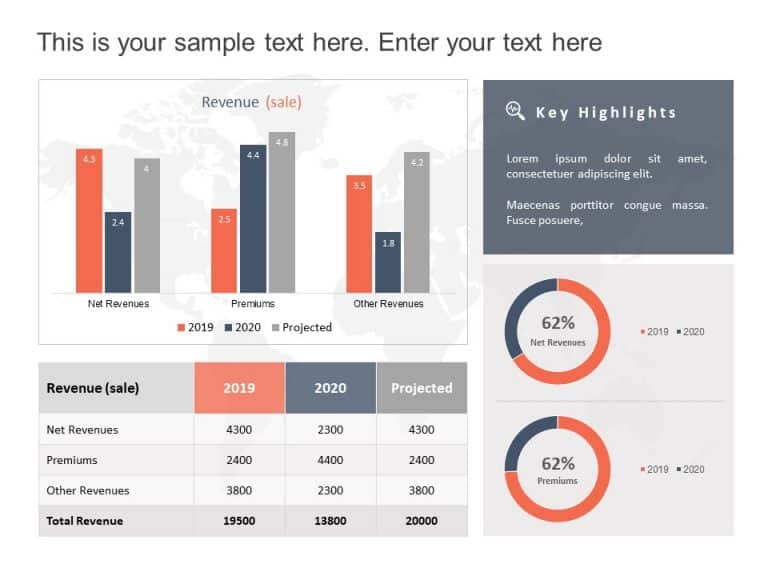
Enhance the structure of your presentation using this captivating template created to display the progression of your products and services throughout time periods effectively. With multiple column graphs included in the design you can articulate data, with precision and clarity making it perfect for corporate meetings sales assessments or discussions, on marketing strategies.
The design of the template is contemporary. Features a color scheme that improves readability and visual attractiveness. Every graph is organized to showcase metrics for three products which enables your viewers to easily understand trends and performance shifts from 2018, to 2021.
Ideal, for business executives looking to communicate details in an concise way; whether evaluating sales trends or addressing product advancement objectives. This template breathes life into your data presentation.
Enhance your presentations instantly by downloading. Use visuals to convey your message and leave a lasting impact. Find more such Graphs & Charts PowerPoint templates for engaging presentations. These templates are compatible with both PowerPoint and Google Slides.


