Flat 4


 Edit with AI
 Ask Us To Edit

Product Description:
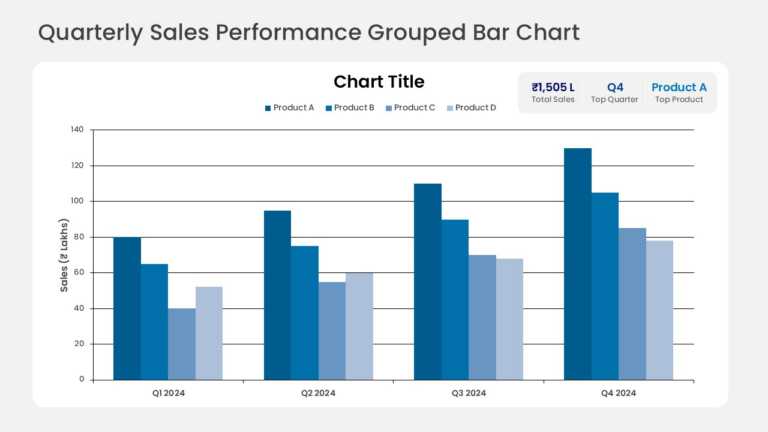
Grouped columns compare quarterly sales across several product lines, with one column per product in each quarter. KPI callout cards above the chart report total annual sales, the top-performing quarter, and the leading product.
Sales directors can open a quarterly business review with the chart to show which products drove revenue each quarter and to frame the forecast for the next period.
Browse more bar chart templates, and structure the rest of the review with our QBR guide with examples. Chart values and KPI cards update directly in PowerPoint or Google Slides.