 Fall Sale
 Flat 40% off on our Unlimited Access Yearly Membership plan!


This cover slide opens a market expansion strategy deck with a prominent title area, a subtitle line, and space for presenter or date details. Th....


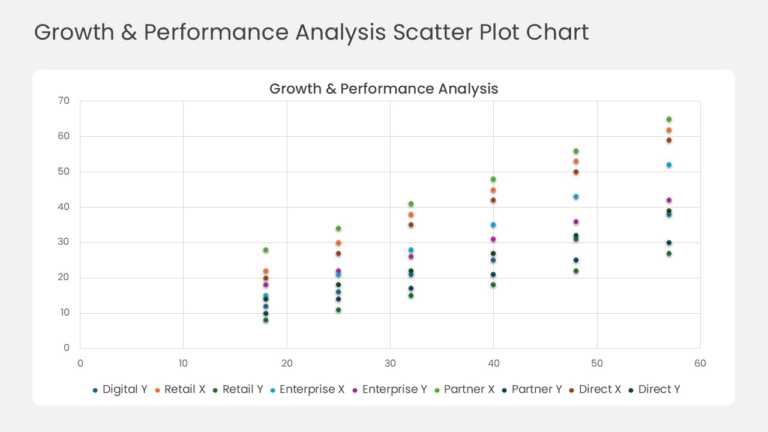
This scatter plot maps business units, products, or regions as individual data points across two performance metrics on the X and Y axes. The lay....
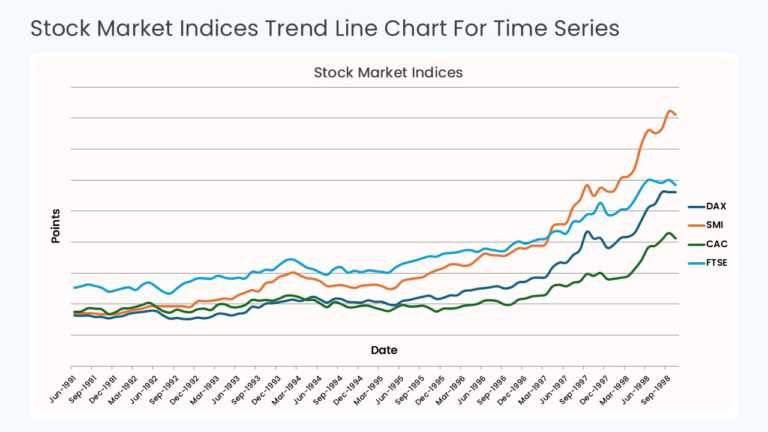
This time series chart plots values against sequential time periods on the X axis, with a trend line connecting each data point. Gridlines and ax....
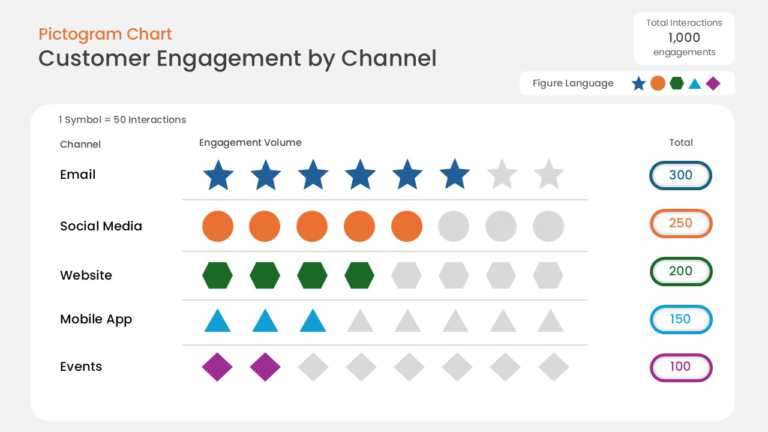
This data pictogram chart expresses values as rows of repeated icons, with filled icons showing the measured share and unfilled icons showing the....
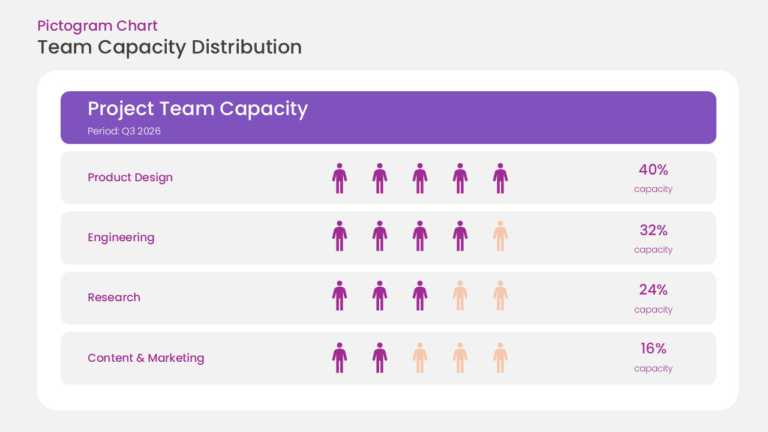
This pictogram chart uses rows of repeated person icons to represent resource capacity. Filled icons indicate allocated resources and unfilled ic....
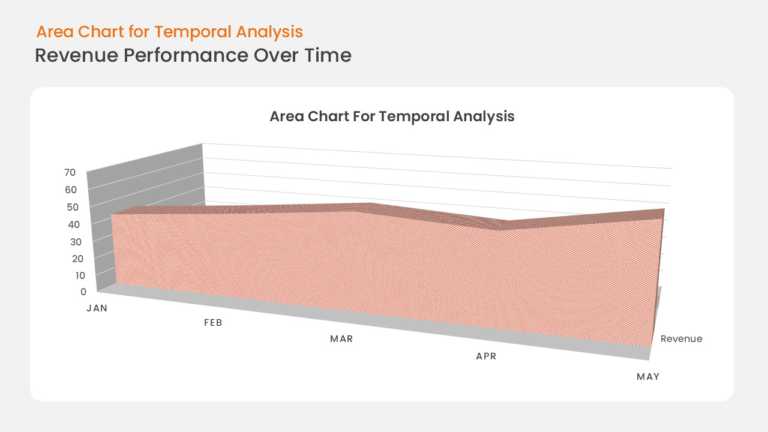
This area chart plots business growth along a time-based X axis, with the region under the trend line filled to emphasize volume and momentum. Ax....