Flat 4


 Edit with AI
 Ask Us To Edit

Product Description:
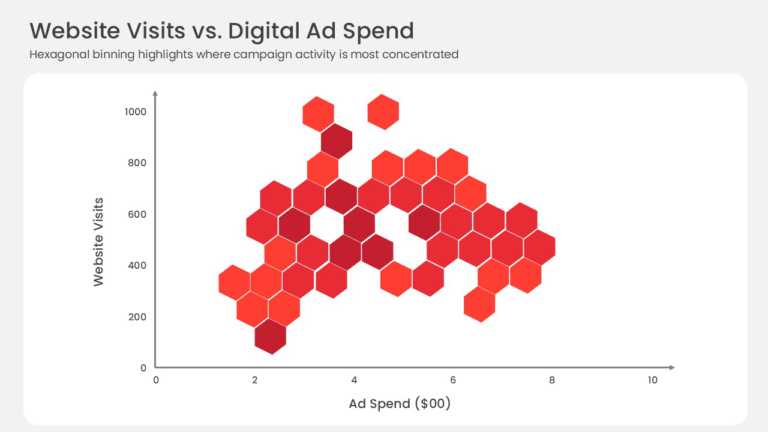
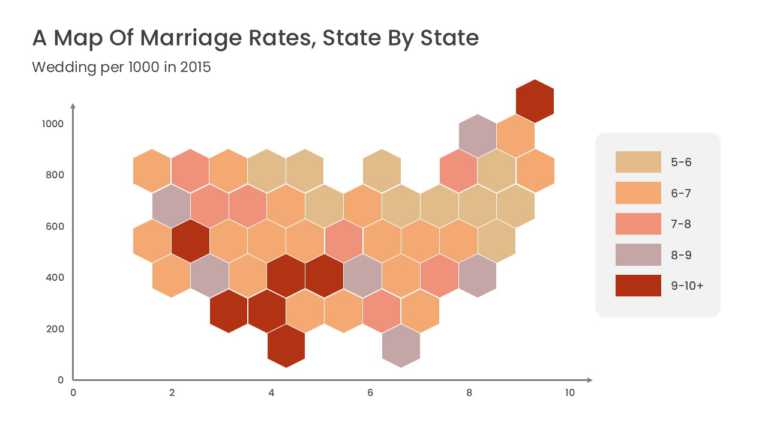
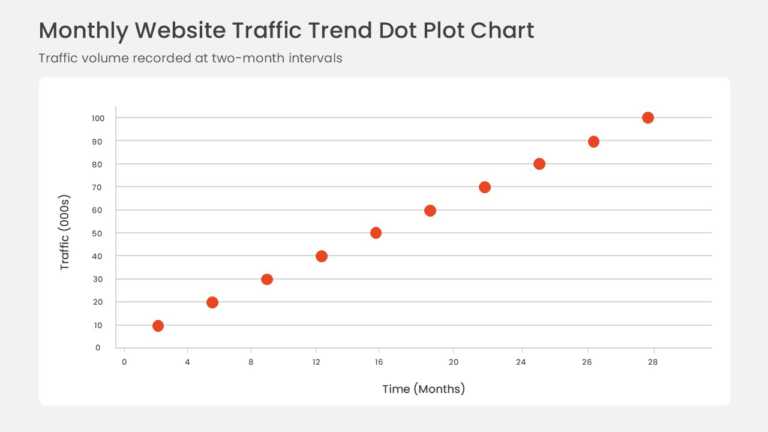
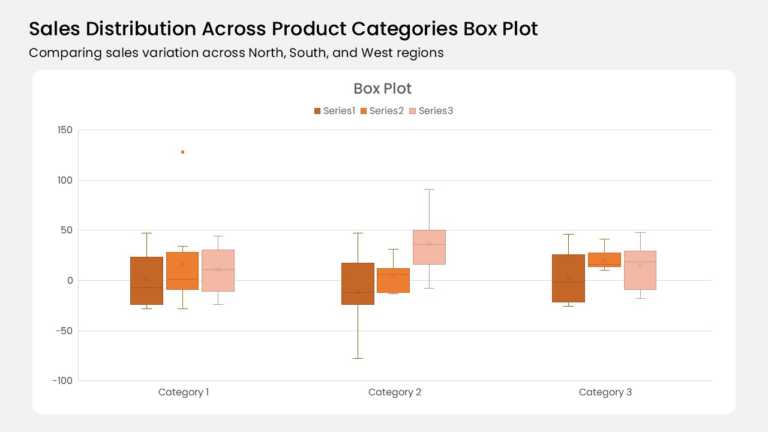
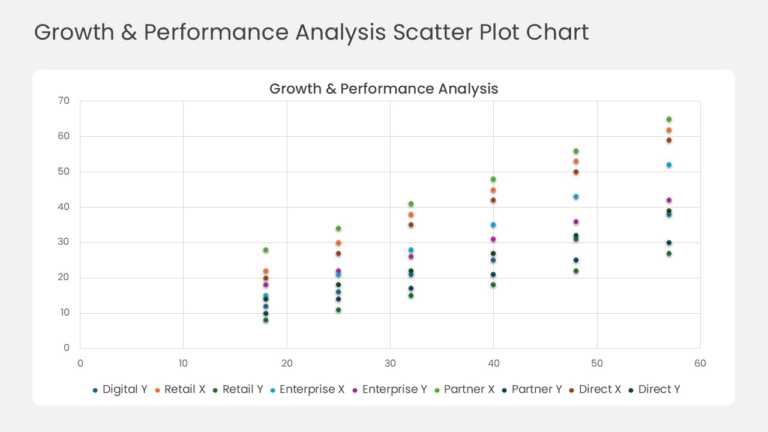
This scatter plot maps business units, products, or regions as individual data points across two performance metrics on the X and Y axes. The layout makes correlations, clusters, and outliers visible, and labels can identify each plotted entity.
A Chief Operating Officer or Performance Analyst can use this chart in a business review to compare units on growth versus margin and identify which ones need intervention. The two-metric view supports portfolio prioritization decisions.
See more performance templates, or read our guide on KPI examples. This template is fully editable and compatible with PowerPoint and Google Slides.