Flat 4


 Edit with AI
 Ask Us To Edit

Product Description:
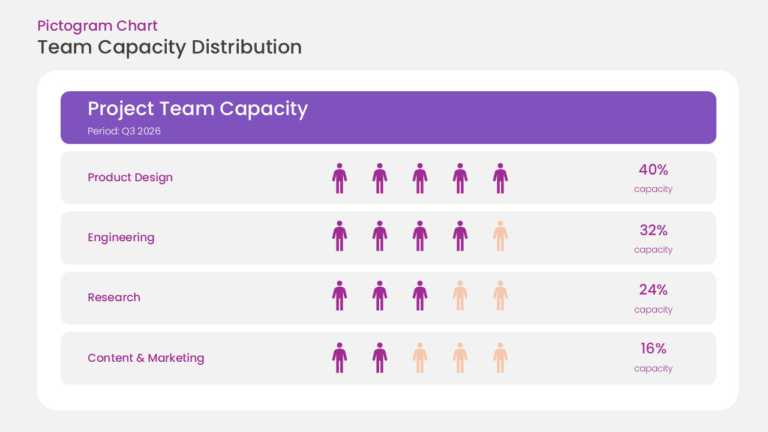
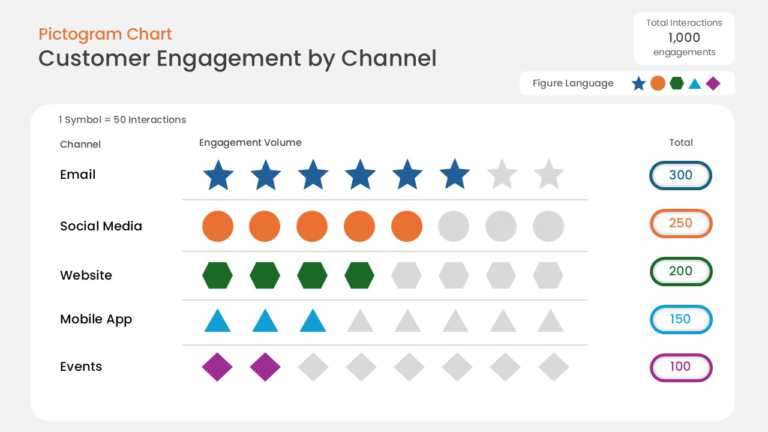
This data pictogram chart expresses values as rows of repeated icons, with filled icons showing the measured share and unfilled icons showing the remainder. Labels next to each row carry the category name and value.
A Marketing Manager or HR Business Partner can use this chart in a survey results presentation to show response rates, adoption levels, or demographic splits. Icon-based ratios are easier for broad audiences to read than a table of percentages.
Browse more data visualization templates, or read our guide on creating infographics in PowerPoint. This template is fully editable and compatible with PowerPoint and Google Slides.