Flat 4


 Edit with AI
 Ask Us To Edit

Product Description:
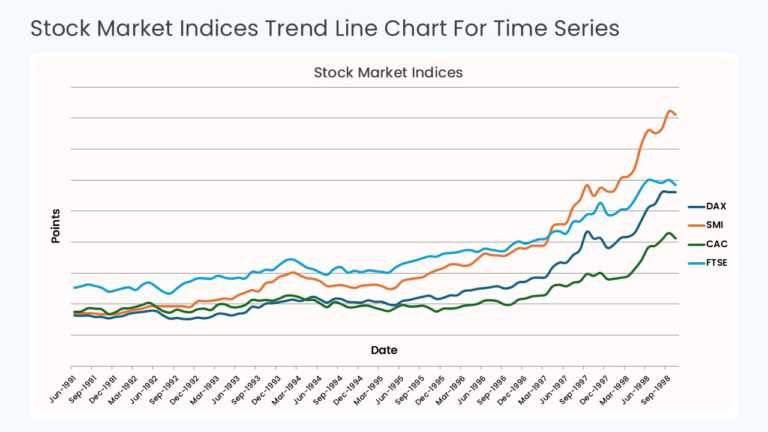
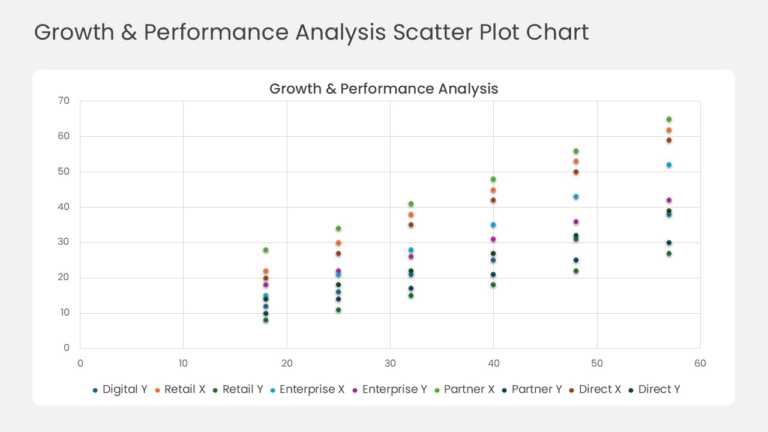
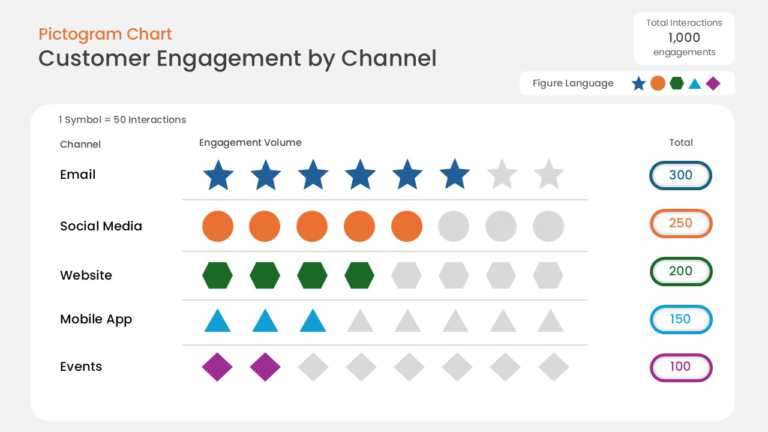
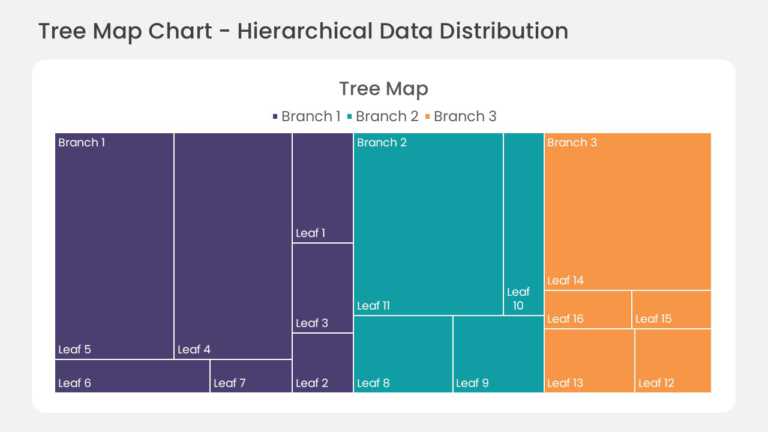
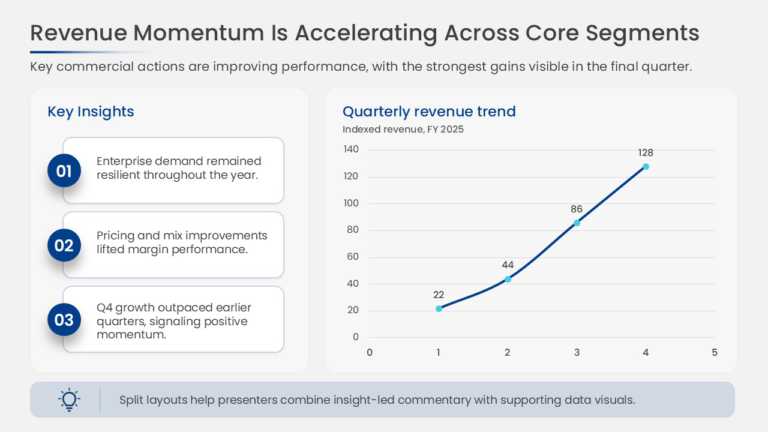
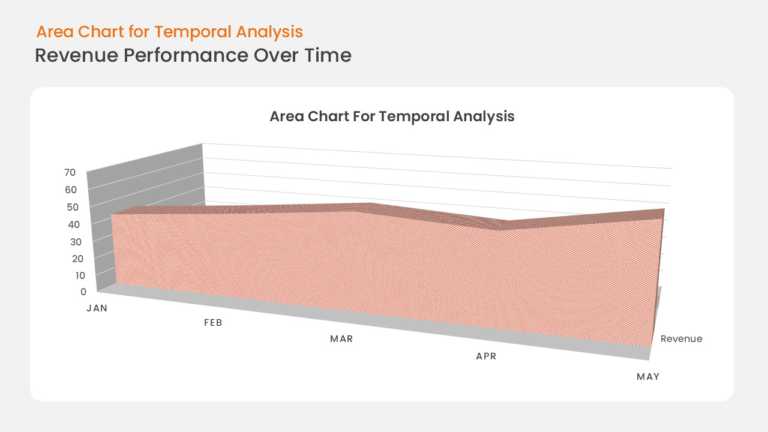
This area chart plots business growth along a time-based X axis, with the region under the trend line filled to emphasize volume and momentum. Axis labels and data markers make it straightforward to read period-over-period change.
A Business Development Director or Founder can use this chart in an investor update or annual review to show revenue, users, or order volume growing over time. The shaded area makes the growth trajectory easy to read at a glance.
See more growth templates, or read our guide on making a graph in PowerPoint. This template is fully editable and compatible with PowerPoint and Google Slides.