Flat 4


 Edit with AI
 Ask Us To Edit

Product Description:
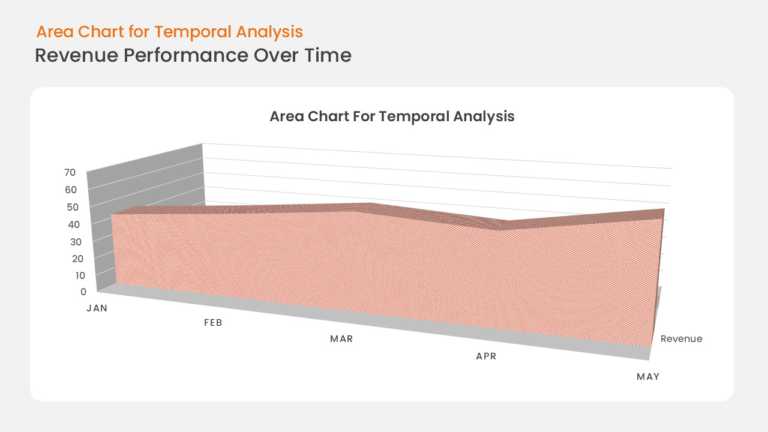
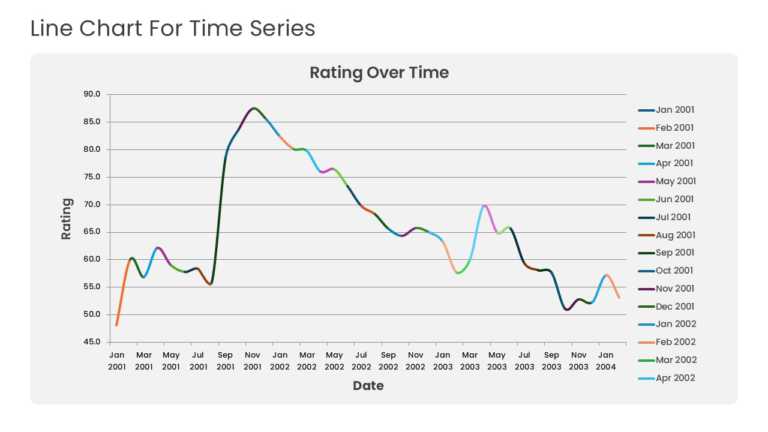
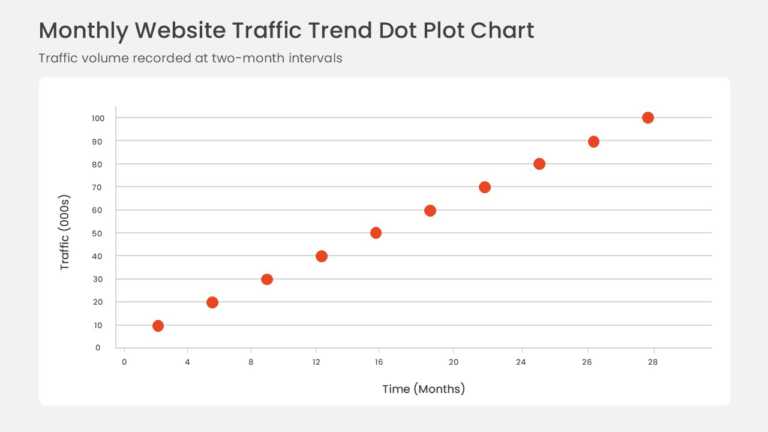
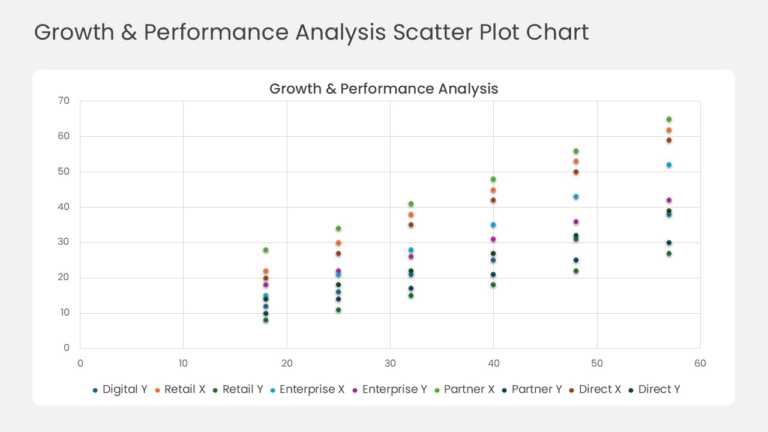
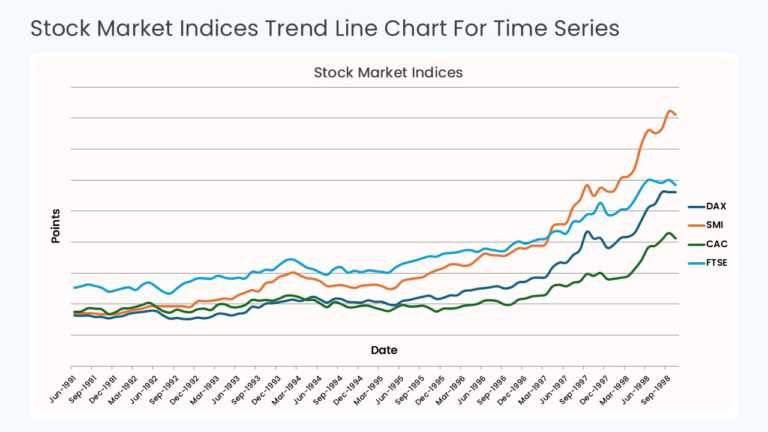
This time series chart plots values against sequential time periods on the X axis, with a trend line connecting each data point. Gridlines and axis labels support accurate reading of peaks, dips, and overall direction across the full period.
A Sales Operations Manager or Business Intelligence Analyst can use this chart in a monthly performance review to show how bookings, traffic, or costs moved over time. It supports forecasting discussions by making seasonality and inflection points visible.
Explore more line chart templates, or read our guide on making a chart in Google Slides. This template is fully editable and compatible with PowerPoint and Google Slides.