Flat 4


 Edit with AI
 Ask Us To Edit

Product Description:
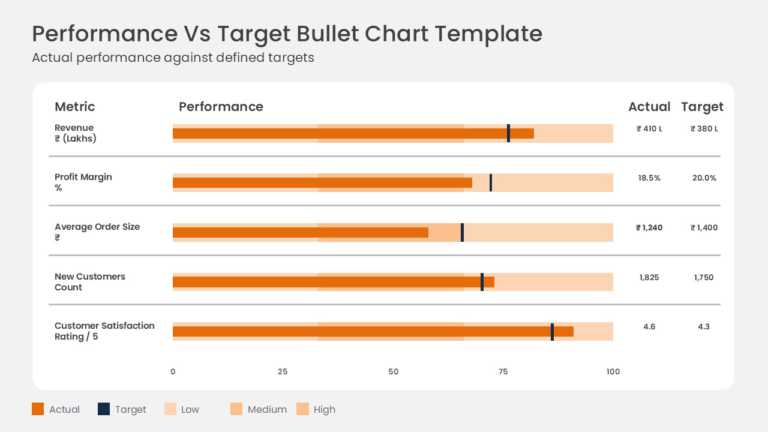
Actual results are measured against targets on horizontal bullet charts for metrics such as gross sales and operating margin. Each row combines a performance bar, a target marker, threshold ranges, and a variance figure.
In a board briefing, a CFO can use the chart to report budget variance and show which metrics are running ahead of or behind plan.
Our KPI slide templates include more performance tracking layouts, and our KPI guide with practical examples helps you choose the right measures. Bars, target markers, and ranges can be adjusted in PowerPoint and Google Slides.