Flat 4


 Edit with AI
 Ask Us To Edit

Product Description:
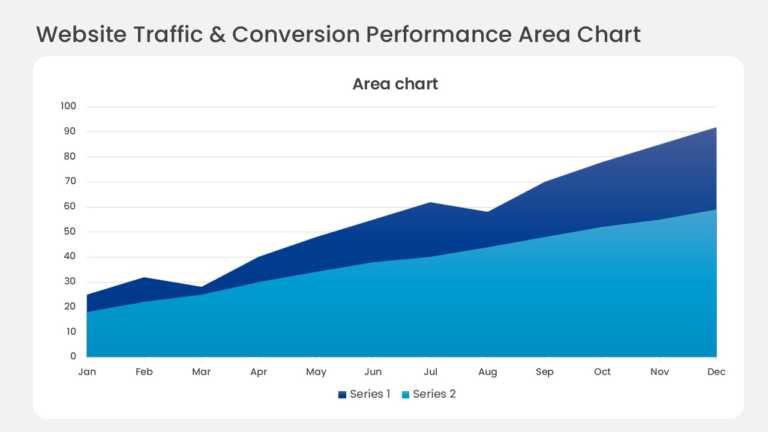
Layered bands in a monthly stacked area chart show website traffic by acquisition channel. The top edge tracks total visitors, and each colored band shows how much a single source contributes month by month.
Digital marketing managers can add the chart to a monthly performance report to show which channels drive audience growth and where acquisition budget should shift.
See more marketing dashboard templates, and read how to present data in the best way for advice on presenting metrics clearly. Channel labels and colors can be edited in PowerPoint and Google Slides.