 Fall Sale
 Flat 40% off on our Unlimited Access Yearly Membership plan!

Comparison PowerPoint Templates & Google Slides
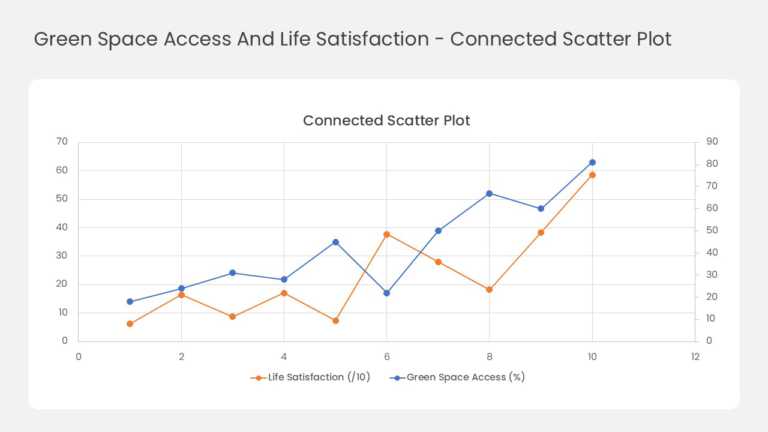
This two-series line chart tracks how two related measures move together across ten data points. Orange markers plot life satisfaction against th....


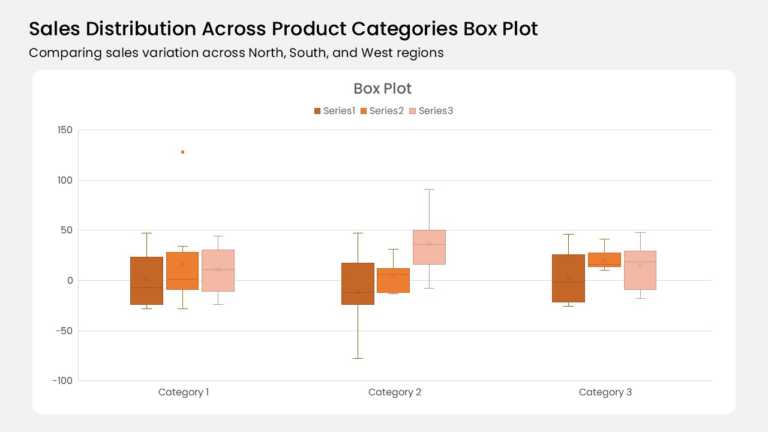
Three category groups anchor this box plot, and each group holds three color-coded boxes. A burnt orange, mid orange, and pale peach series run l....
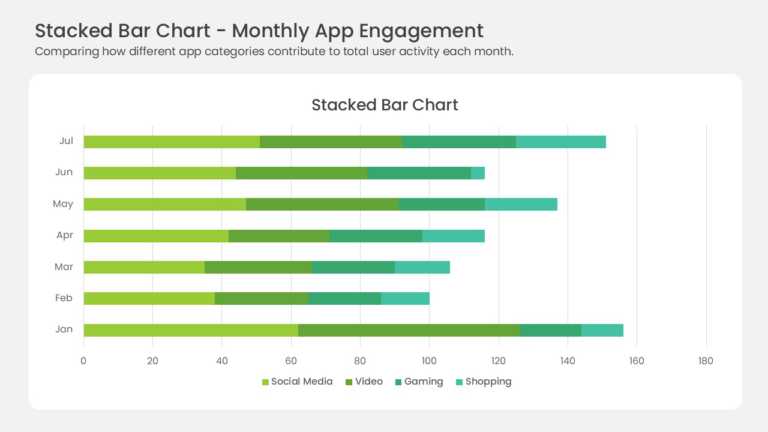
Seven horizontal bars stack four data series across the months January through July. Yellow-green, medium green, teal, and mint segments mark Soc....
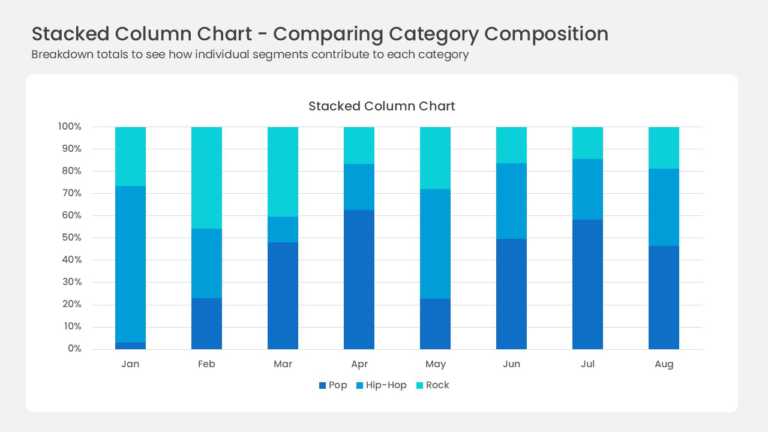
Eight full-height columns run from January to August, each one normalized to 100 percent. Three blue series divide every column: deep navy Pop, b....
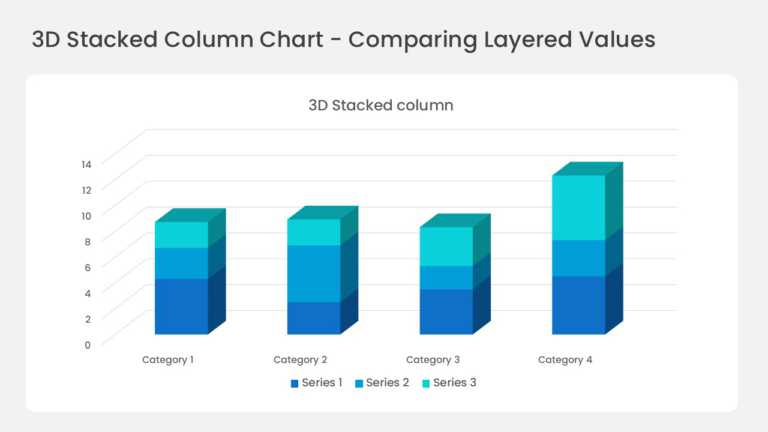
Four three-dimensional columns sit on a perspective floor with gridlines running back into the wall. Each column stacks three series in deep blue....
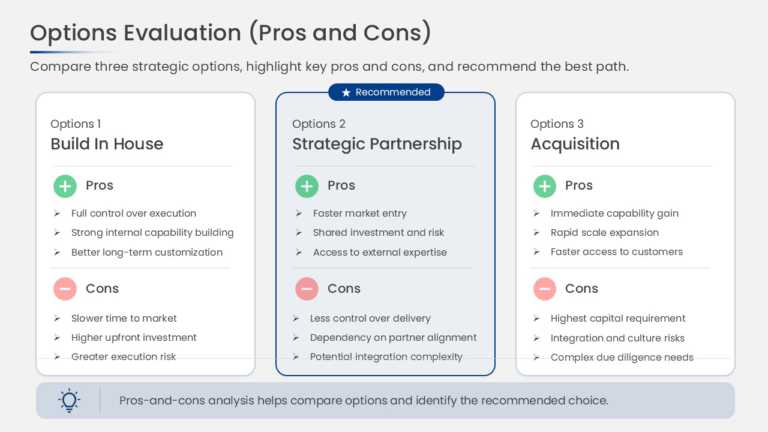
This comparison slide presents strategic options side by side, with separate pros and cons sections for each option. The parallel column structur....