Flat 4


 Edit with AI
 Ask Us To Edit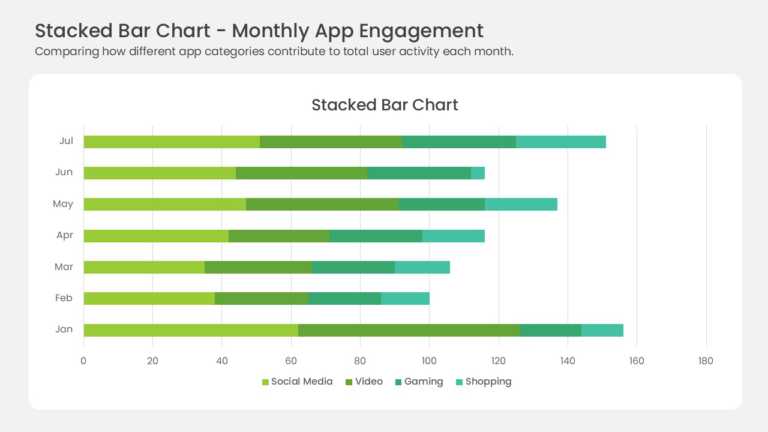

Product Description:
Seven horizontal bars stack four data series across the months January through July. Yellow-green, medium green, teal, and mint segments mark Social Media, Video, Gaming, and Shopping. Each bar shows both its own total and the mix inside it. A value axis runs from 0 to 180, and the legend sits below the chart.
Product and growth teams track channel mix with exactly this view. The layout suits monthly engagement reviews, campaign readouts, and board updates on user activity. Marketing managers can spot which category drives a spike without adding a second slide.
Explore more chart templates for data visualization when your numbers need a sharper frame. Our guide on presenting data effectively adds slide-level tips. The download covers 4:3 and 16:9, and every segment, color, and label stays editable in PowerPoint & Google Slides.