Flat 4


 Edit with AI
 Ask Us To Edit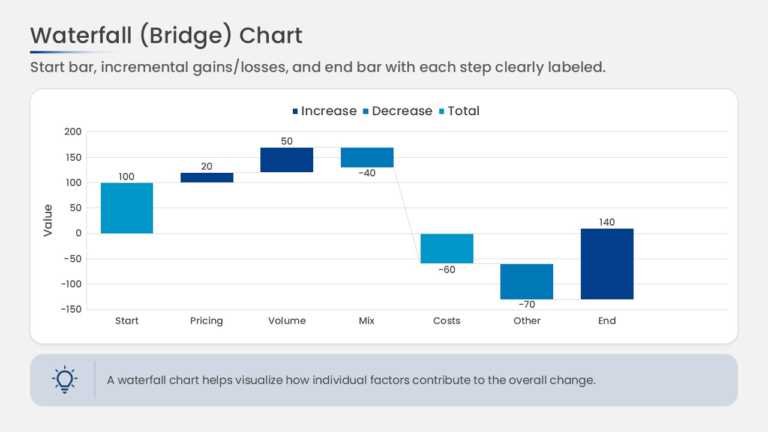

Product Description:
This waterfall chart bridges a starting value to an ending value through a series of floating bars. Increases and decreases are shown as separate bars in contrasting colors, and the anchored total bars at each end make the net variance clear.
A Financial Controller or FP&A Lead can use this chart in a monthly variance review to explain how budget became actuals through price, volume, and cost drivers. The bridge format shows exactly which factors moved the result and by how much.
Browse more finance presentation templates, or read our guide on financial presentation examples. This template is fully editable and compatible with PowerPoint and Google Slides.