

Org Chart Examples: 12 Real Examples by Type & Industry [+ Free Templates]
An organizational chart (org chart) is a diagram that shows a company’s internal structure — who reports to whom, how teams are grouped, and where each role sits in the hierarchy. It maps reporting lines and the flow of authority from leadership down to individual contributors, making it instantly clear how an organization is run.
Org charts range from a simple top-down pyramid to a complex cross-functional grid, depending on a company’s size, industry, and culture. In this guide you’ll find 12 org chart examples — organized first by type and then by industry — each with a real role hierarchy you can copy, plus a free, editable template for PowerPoint and Google Slides.
Want to skip the build?
Browse SlideUplift’s complete Org Chart template library—every example featured in this content is a fully editable template, ready to customize in minutes.
What Is an Organizational Chart?
An organizational chart is a visual diagram of a company’s structure. It uses boxes for roles or people and lines for reporting relationships, so anyone can see the chain of command at a glance. Organizational charts are also called organograms, organigrams, or hierarchy charts — different names for the same thing.
Most org charts include each person’s name, job title, and department, connected by lines that show who reports to whom. Solid lines usually mark a direct supervisor–subordinate relationship; dotted lines mark a secondary or advisory one (common in matrix structures).
The first org chart is credited to engineer Daniel McCallum in 1855 (drawn with George Holt Henshaw) to manage the New York and Erie Railroad — a useful reminder that org charts exist to make complex structures legible, not just to fill a slide.
What Is an Org Chart Used For?
A clear org chart benefits a business of any size. The most common uses are:
- Establishing authority and communication routes. It removes ambiguity about who is responsible for what and how information should flow, preventing miscommunication.
- Onboarding new hires. New employees understand the company structure on day one without having to ask around. Gallup has reported that only about 12% of employees strongly agree their organization onboards new hires well — structure helps close that gap.
- Workforce and resource planning. Leaders can spot gaps, overlaps, or overloaded teams before they become problems.
- Restructuring and growth. When companies grow or reorganize, an updated org chart keeps everyone aligned. In Deloitte’s 2016 Global Human Capital Trends report, 92% of organizations rated redesigning the organization as a critical priority.
- Improving motivation. A documented structure doubles as a roadmap that shows employees where their next promotion might come from.
Small businesses often skip org charts, assuming they’re only for large companies. In reality, an org chart future-proofs a growing business — giving you a concrete reference as roles multiply.
The 7 Types of Org Charts
There are seven org chart types you’ll encounter most often. Use this table to pick the right one for your structure, then jump to the detailed example below it.
| # | Type | What It Is | Best For |
| 1 | Line (Scalar) | Authority flows straight from the top down a single chain of command | Small businesses; routine, automated work |
| 2 | Functional / Staff | Staff grouped by specialization, each led by an expert | Organizing around departments & expertise |
| 3 | Line & Functional | Combines a clear chain of command with specialist advisors | Most large organizations |
| 4 | Matrix | Grid; employees report to both a functional and a project manager | Cross-functional, project-driven companies |
| 5 | Divisional | Organized by product, market, or geography; runs semi-independently | Large or multinational corporations |
| 6 | Project | Specialists from different functions grouped around a project | Project- and product-based teams |
| 7 | Committee | A group that jointly develops strategy and policy | Governance, boards, steering committees |
A widely cited Gallup survey found that 84% of U.S. employees are at least somewhat “matrixed,” underscoring how common blended structures have become.
Org Chart Examples by Type
1. Line (Scalar) Organizational Chart
Also called a scalar structure, a line org chart shows authority flowing directly from the top position to the lowest, with each person reporting to exactly one supervisor.
Example hierarchy: Owner/CEO → Department Head → Supervisor → Team Members.

It simplifies and clarifies responsibility and accountability — authority follows a single chain of command. The trade-off: it’s rigid, and line managers have no specialist staff to consult, so it works best for small businesses or routine, highly automated environments.
2. Functional (Staff) Organizational Chart
A functional org chart organizes people by their skills and specialization. The organization is split into departments, each managed by an expert.
Example hierarchy: CEO → VP Finance · VP Marketing · VP IT · VP Operations → Managers → Specialists within each function.
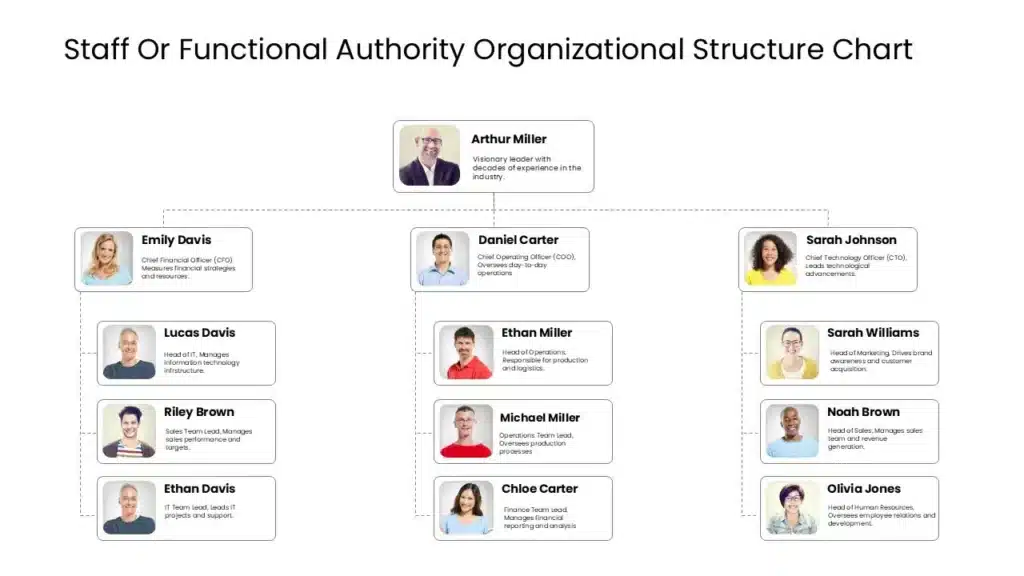
Grouping specialists together improves efficiency and depth of expertise. The risk is “silos” — departments that communicate poorly with one another.
3. Line and Functional Organizational Chart
Most large organizations use this hybrid. Authority still flows top-down (line managers make the decisions), but functional specialists provide expert advice in an advisory role.
Example hierarchy: CEO → Line Managers (decision-makers) ↔ Functional Specialists (advisors) → Teams.
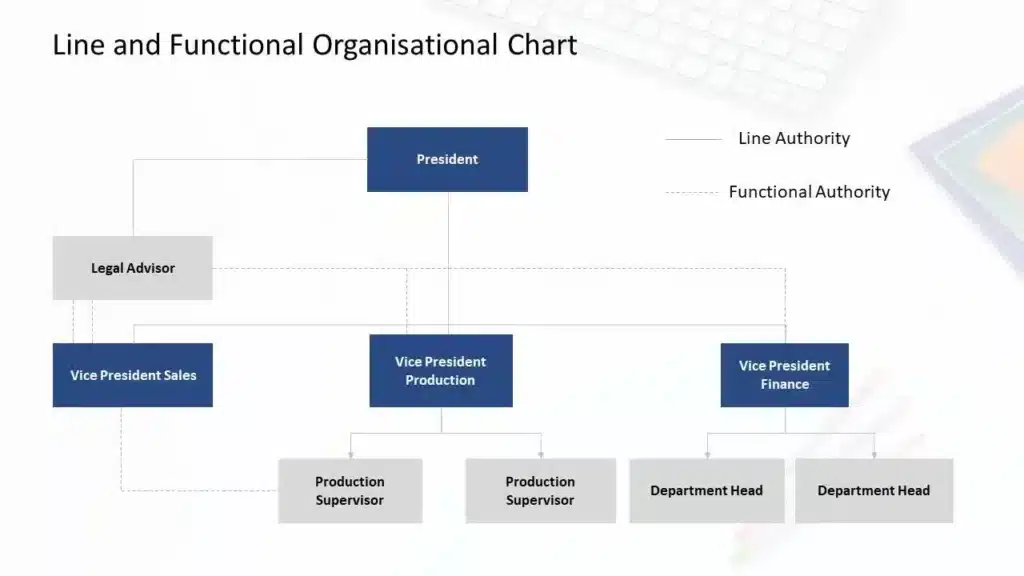
The main advantage: line managers get expert input while staying focused on execution, avoiding the weaknesses of pure line or pure functional structures.
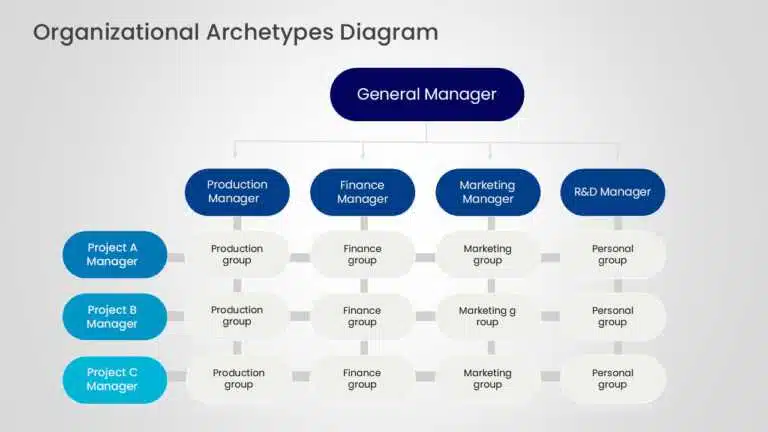
4. Matrix Organizational Chart
A matrix chart looks like a grid rather than a pyramid. Employees typically report to two managers: their department head and a project manager overseeing a specific initiative. (A RACI chart is a popular companion for clarifying who is Responsible, Accountable, Consulted, and Informed.)
Example hierarchy: Engineer → reports to Engineering Director (function) and Project Manager (initiative).
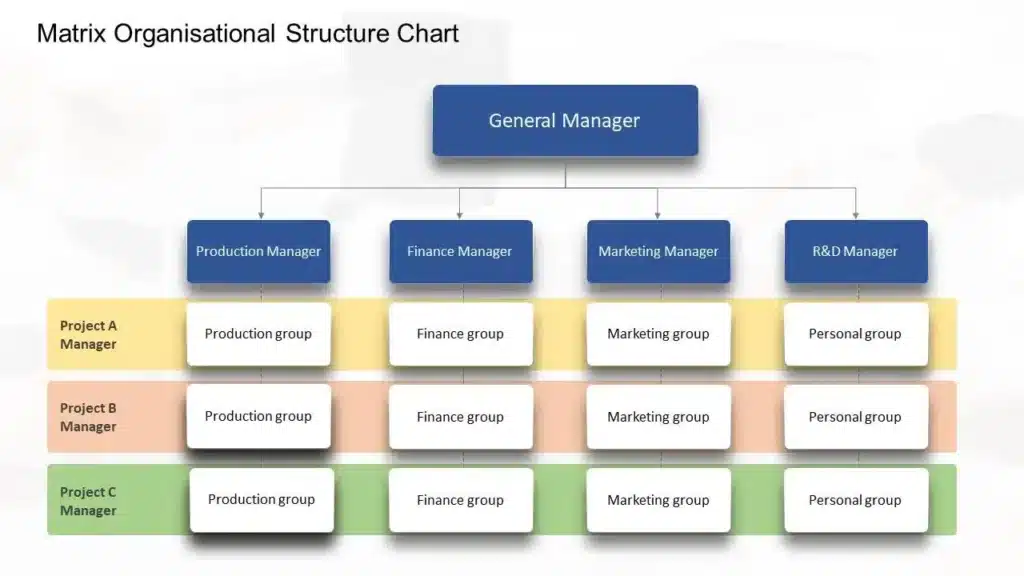
Matrix structures emphasize efficiency, collaboration, and innovation, and expose employees to multiple project types. The downside is the potential for confusion when two managers set competing priorities.
5. Divisional Organizational Chart
A divisional structure organizes the business around geography, market, or product lines. Each division operates semi-independently with its own sales, production, finance, and support staff.
Example hierarchy: CEO → Division A (e.g., North America) · Division B (e.g., EMEA) → each with its own functional teams.
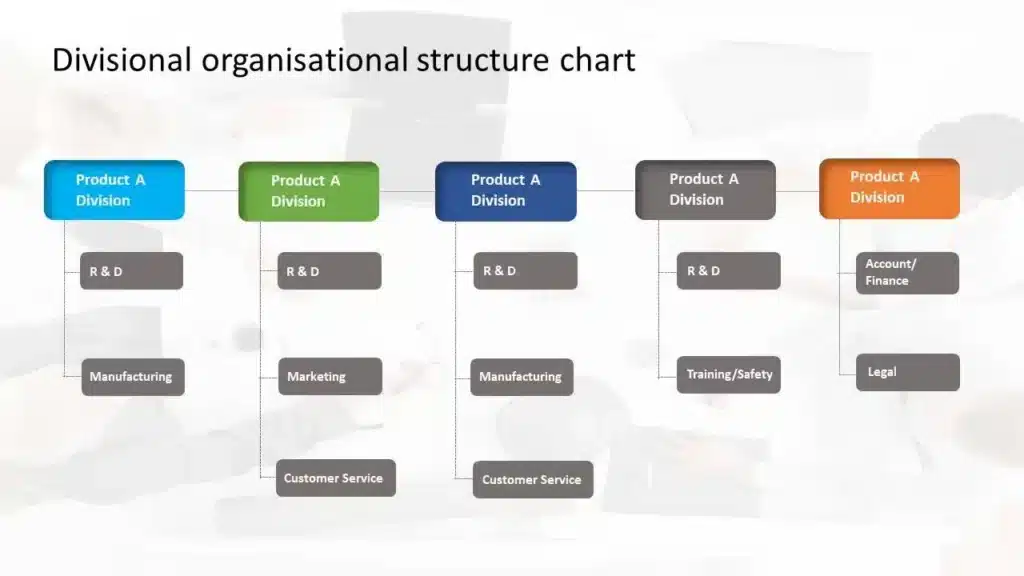
Large multinationals favor this model for the flexibility it gives each division to focus on its own priorities. The trade-off is duplicated resources across divisions.
6. Project Organizational Chart
A project org chart coordinates a specific project by pulling specialists from different functional areas into one team. A project team chart shows each member’s role and relative authority.
Example hierarchy: Project Sponsor → Project Manager → Workstream Leads (e.g., Design, Engineering, QA) → Contributors.

It makes relationships, structure, and power positions clear for the duration of the project.
7. Committee Organizational Chart
A committee structure is a group of members who jointly discuss problems and develop strategic solutions, plans, and policies.
Example hierarchy: Chairperson → Committee Members (each bringing distinct expertise) → Sub-committees.
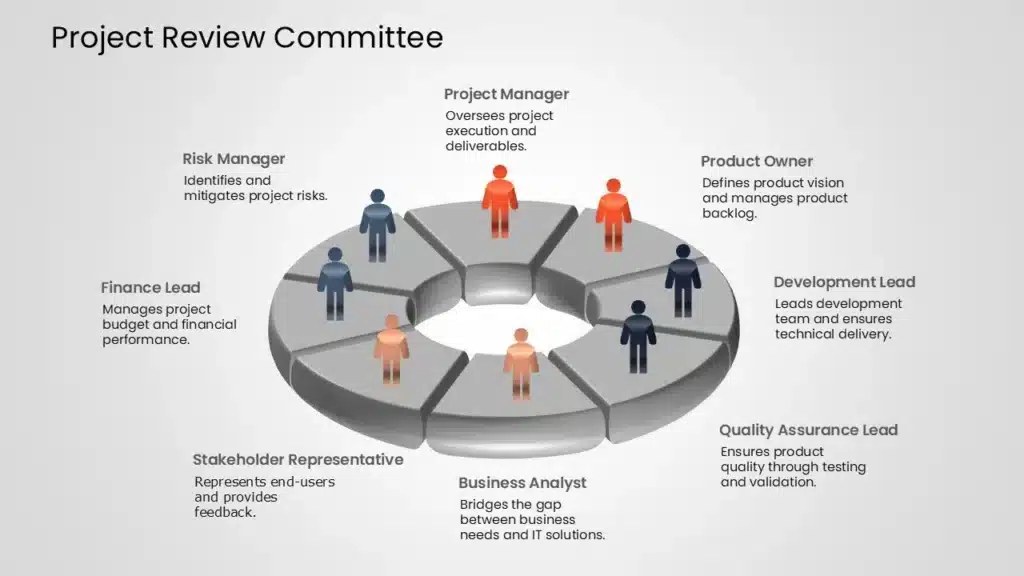
Committees are valuable because they pool diverse experience and perspectives that no single person could provide — common in boards and steering committees.
Org Chart Examples by Industry
The same types adapt to any industry. Here are five real-world hierarchies you can model — each with a downloadable template.
1. Corporate / Company Org Chart Example
A corporate org chart outlines top-level departments under executive leadership.
Example hierarchy: CEO → CFO (Finance) · COO (Operations) · CMO (Marketing) · CTO (Technology) → Directors → Managers → Staff.
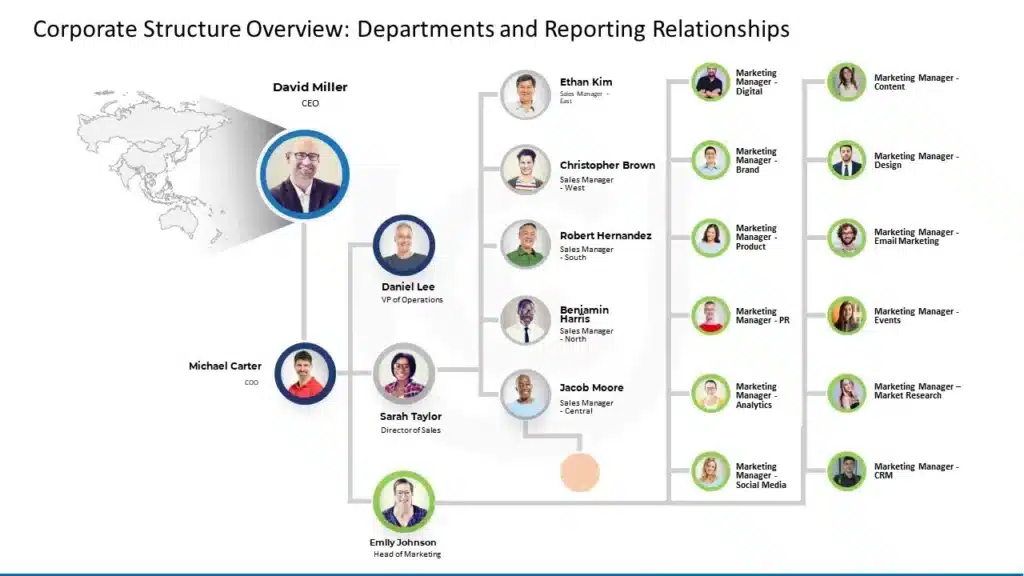
Use it to show clear lines of authority across the whole company in client-facing decks and board presentations.
2. Finance Org Chart Example
Ideal for a bank, investment firm, or insurance company.
Example hierarchy: CFO → Controller · Treasurer · Head of FP&A → Accounting Manager · Tax Manager · Financial Analysts.

It clarifies how financial control, reporting, and analysis responsibilities are divided.
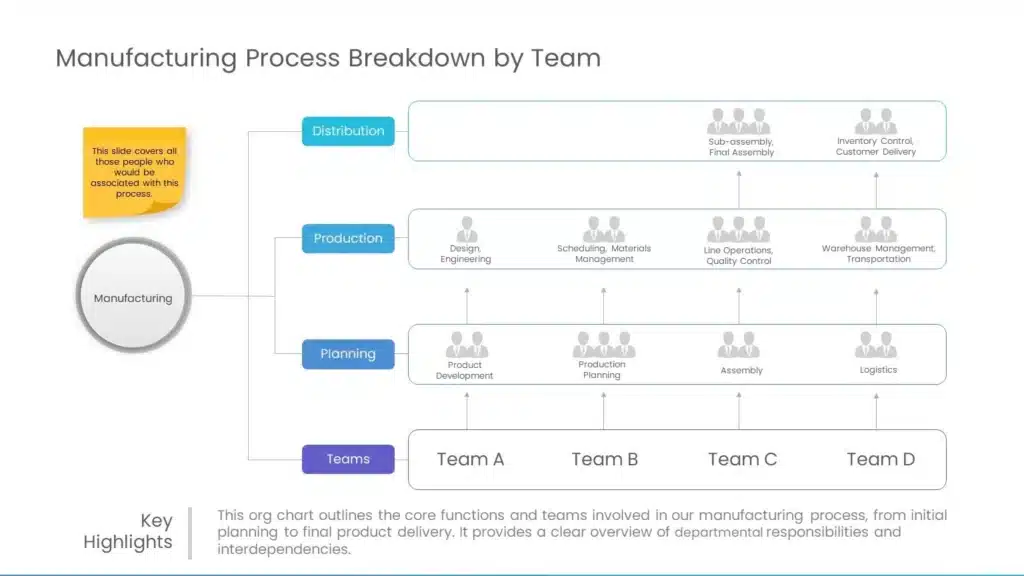
3. Manufacturing Org Chart Example
Manufacturing charts define roles, visualize the production process, and surface bottlenecks.
Example hierarchy: Plant Manager → Production Manager · Quality Control Manager · Supply Chain Manager → Shift Supervisors → Line Operators.
4. Marketing Org Chart Example
One of the most commonly searched examples. A marketing org chart improves collaboration, speeds onboarding, and shows structure to clients and partners.
Example hierarchy: CMO → Brand Director · Digital Marketing Director · Content Director → Brand Managers · SEO/Paid Leads · Content Strategists → Specialists.

5. HR Org Chart Example
An HR org chart maps the people function across recruitment, employee relations, and total rewards.
Example hierarchy: CHRO → Talent Acquisition Lead · Employee Relations Lead · Compensation & Benefits Lead → Recruiters · HR Business Partners · Benefits Analysts.

These are 12 ready-to-use examples across types and industries. The fastest way to find one that fits is to browse SlideUplift’s complete range of org chart templates.
Organizational Archetypes: Structure Beyond the Chart
The seven types above describe how reporting lines are drawn. But an org chart also makes a statement about a company’s values, culture, and philosophy — and on that level, organizations tend to fall into a few broader organizational archetypes. Choosing the right archetype before you design your slide makes for a far clearer organizational structure presentation, because the layout will reflect how the company actually behaves, not just who sits where.
Three archetypes extend beyond the classic pyramid:
- Flat archetype. Few or no middle-management layers sit between leadership and staff. It speeds up communication and decision-making and is common in startups, agencies, and small, self-managed teams.
- Team-based archetype. Built around cross-functional teams rather than fixed departments, this archetype disrupts the traditional hierarchy to emphasize problem-solving, collaboration, and employee ownership — think Scrum or “tiger” teams.
- Network archetype. Instead of a rigid internal hierarchy, this archetype maps relationships across vendors, subcontractors, freelancers, and satellite offices, emphasizing open communication and connections over chain of command.
Most real companies blend an archetype with one of the structural types — for example, a flat archetype drawn as a functional chart, or a network archetype presented with a circular layout. When you build the slide, pick the archetype that matches your culture first, then choose the chart type that displays it most clearly.
Browse layouts suited to each archetype — from minimal flat structures to circular, team-centered designs — in the org chart template library.
How to Make an Org Chart
You can build an org chart from scratch or start from a template. The shortcut is to download an editable example and swap in your own names and roles.
The basic steps:
- Collect names, job titles, departments, and reporting lines (work with HR for accuracy).
- Pick the structure that matches how your organization actually works — don’t default to hierarchical.
- Start at the top and work down, adding a box per role and connecting reporting lines.
- Keep it clean: consistent shapes, clear labels, minimal clutter.
- Customize colors and add photos or icons for clarity.
Prefer a walkthrough? See our step-by-step guides on how to create an org chart in PowerPoint and how to make an org chart in Google Slides.
Org Chart Best Practices
- Start at the top with the highest-ranking role and work downward.
- Use boxes for roles and lines for reporting — solid for direct reports, dotted for advisory/matrix relationships.
- Keep it simple and consistent — uniform shapes, spacing, and labels.
- Use color and grouping to distinguish departments without adding clutter.
- Keep it current. An outdated chart with wrong titles causes more confusion than no chart at all — set a review schedule.
FAQs
-
What is an organizational chart?
An organizational chart is a diagram that shows a company’s internal structure — its roles, departments, and reporting relationships. Boxes represent positions or people, and connecting lines show who reports to whom.
-
What are the main types of organizational charts?
The most common are line (scalar), functional, line-and-functional, matrix, divisional, project, and committee charts. Many companies blend two or more — for example, combining functional and matrix structures.
-
What is the best layout for an org chart?
A top-down pyramid (hierarchical) works for most organizations because it clearly shows who’s in charge. Flat, circular, or grid layouts can fit better for startups, agile teams, or matrixed companies. Choose the layout that reflects how your team actually operates.
-
How do I organize an org chart?
Start at the top with the highest position, use boxes for roles and lines for reporting relationships, keep labels clear and consistent, and avoid clutter so the structure is easy to read at a glance.
-
Can I make an organizational chart in PowerPoint or Google Slides?
Yes. You can create an org chart in PowerPoint using SmartArt or shapes, or make one in Google Slides with the built-in hierarchy diagram. Editable SlideUplift templates are the fastest starting point.
-
What's the difference between a hierarchical and a matrix org chart?
A hierarchical chart has a single chain of command — each person reports to one manager. A matrix chart has employees reporting to two managers at once (usually a functional manager and a project manager), shown as a grid rather than a pyramid.
-
What is an organizational chart called?
Org charts are also known as organograms, organigrams, organization charts, and hierarchy charts. They all refer to the same thing.
-
Are SlideUplift's org chart templates free?
SlideUplift offers both free and premium org chart templates for PowerPoint and Google Slides, all fully editable. Browse the org chart template library to download one.


Related posts from the same category

9 Oct, 2022 | SlideUpLift
5 Organizational Chart Archetypes for PowerPoint Presentations (including Templates)
When we think about organizational charts, we frequently think of top-down, pyramid-like charts represented visually. The fact remains, that this is only one of many different variants of business organizational

6 Jan, 2021 | SlideUpLift
7 Tips for Remote Employee Onboarding | (Plus Employee Onboarding Templates )
Virtual work setups are quickly rising in popularity amongst companies worldwide. A report by FlexJobs shows that remote work grew by 44% in the last five years. In the last

20 Feb, 2024 | SlideUpLift
Start Stop Continue Retrospective: A Complete Guide With Examples, Templates & Exercises
A Start Stop Continue retrospective is a team reflection exercise where each member names one thing the team should start doing, one it should stop, and one it should continue.

30 Jan, 2024 | SlideUpLift
9 Box Talent Review Explained [Detailed 9 Box Matrix Guide]
Performance evaluations are essential for HR professionals because they allow them to assist individuals in reaching their maximum potential early on. However, abstract notions like initiative and employee involvement are

14 Sep, 2021 | SlideUpLift
Learn How To Give A Great Performance Review To Your Employees
This article defines what is a performance review, explains how to write and present a successful employee performance review. If you work in management or as a supervisor, you may

28 Feb, 2023 | SlideUpLift
Gardner’s Theory of Multiple Intelligences: All 8 Types Explained
Quick Answer: Gardner's Theory of Multiple Intelligences proposes that intelligence is not one fixed ability but a set of at least eight distinct types — linguistic, logical-mathematical, spatial, bodily-kinesthetic, musical,

30 May, 2024 | SlideUpLift
10 Best Free PowerPoint Templates You Need To Check Out
The internet is full of templates for presentations, but finding a free template that matches your needs and compatibility is frustrating. Not anymore! We have compiled a list of our

13 Jun, 2025 | SlideUpLift
How to Make an Org Chart in PowerPoint: Step-by-Step Guide [+ Templates]
Without a clear org chart, even small teams feel messy. People start asking: “Who’s responsible for what?” Whether you are a manager, HR professional, or team lead, explaining the team

12 Jun, 2025 | SlideUpLift
How to Make an Org Chart in Google Slides: A Step-by-Step Guide
Want to map out any type of organizational structure—whether it's a company, project team, or even a hierarchy? An org chart helps visualize relationships between roles, departments, or functions in

23 Apr, 2025 | SlideUpLift
Presentation Statistics: What You Need to Know for Your Next Presentation
In 2025, presentations have evolved far beyond static slide decks and long monologues. Modern presentations are dynamic, interactive, and data-driven, designed to captivate audiences, enhance understanding, and inspire action. Whether