

What is KPI? Step-by-Step Guide with KPIs Examples That Work
Is it hard for you to know if your business is getting to the level it should be? That’s where key performance indicators (KPIs) come into play. KPIs indicate how well your strategies are performing. When you don’t have the right KPIs, you could be guessing on every business decision you make and hoping for the best.
KPIs take guessing out of growth. They show you what is and isn’t working to shape your plan of action. KPIs communicate specific overall metrics like sales performance, customer satisfaction, and team productivity by making them specific and actionable.
In this blog, we will help you understand KPIs – what is KPI their types, KPIs examples, best practices for KPIs, and how to choose KPIs for your business. We’ll cover everything you need to know so that you will be prepared to track, measure, and report on performance like a professional.
What is KPI Meaning, and Why Do You Need Them?
In business, KPI stands for Key Performance Indicator. A KPI is a measurable value that demonstrates how effectively an individual, team, or organization is achieving key business objectives. In the simplest terms, KPIs are a business’s navigation system; they help show whether you are headed down the right path towards your goals.
Every business sets objectives and key results, but without measurable indicators, it is difficult to know where you are in relation to your objectives or recognize areas where you want to improve. KPIs are designed to measure quantifiable progress over time. Examples of KPIs include sales growth, customer satisfaction levels, website traffic, or project completion rates.
- Why do you need KPIs?
- To track progress accurately: KPIs designate measurable benchmarks that will help you understand whether you are on track. Instead of vague goals like “increase sales,” a KPI will designate a target threshold like “increase sales by 15% this quarter”.
- To make better data-driven decisions: Using clear KPIs with metrics and gauges, enhanced by KPI dashboards, provides leaders with the opportunity to be smarter in their decisions, be agile and alter strategies, and allocate resources efficiently.
- To improve communication and reporting: KPIs make reporting performance easier and simpler. Overall, visual dashboards and presentation slides can help you report on your performance, but also quickly communicate performance to a wider audience.
What Are the Five Key Elements of a KPI?
A good KPI is not just a number, but a systematic measurement of business performance that provides a framework for improvement. Each KPI should have five elements:
- Specific: KPIs should have a clear and concise end state. Avoid ambiguous outcomes like “raise revenue,” and instead use something specific like “raise monthly recurring revenue by 10%.”
- Measurable: If it is not measurable, you cannot measure improvement. Each KPI should be measurable and have data that is quantifiable and can be measured over time.
- Achievable: KPIs should be realistic and achievable. If the target is beyond realistic expectations, you will not inspire or motivate your project team. But if you take achievable targets, that inspires improvement and progress.
- Relevant: KPIs should be relevant to business goals and objectives. A marketing team may want to track the conversion rates of leads, but tracking turnover ratios related to investments is not relevant.
- Time-bound: KPIs should always be time-bound, whether on a weekly, monthly, or quarterly performance track. This gives context for each KPI to establish a defined period to determine the performance of the KPI.
Indicators vs. Key Performance Indicators
| Aspect | Indicators | Key Performance Indicators (KPIs) |
| Definition | General metrics that provide information about activities or outcomes. | Specific metrics that measure progress toward strategic business goals. |
| Focus | Tracks what is happening, often at an operational level. | Tracks how well objectives are being achieved, with strategic alignment. |
| Examples | Website visits, number of customer inquiries, and hours worked. | Customer satisfaction score, sales revenue growth %, and employee retention rate. |
What Are the Different Types of KPIs?
There are multiple forms of categorizing KPIs, depending on the type and focus of the goals of your organization. The most basic distinction is between Leading vs. Lagging KPIs. Leading KPIs are forward-looking and will help to estimate future performance, whereas Lagging KPIs are mainly backward-looking and they measure outcomes, and objectively indicate whether goals were accomplished. Knowing the difference will help the organization implement KPIs in a way that helps monitor performance.
Leading KPIs vs. Lagging KPIs
| Aspect | Leading KPIs | Lagging KPIs |
| Definition | Predictive metrics that measure activities or inputs influencing future results. | Outcome metrics that measure the actual results after activities are completed. |
| Purpose | Help forecast performance and allow proactive adjustments. | Show whether objectives were achieved, but cannot change past outcomes. |
| Examples | Number of leads generated, employee training hours, and website sign-ups. | Quarterly sales revenue, customer satisfaction scores, and profit margins. |
| Timeframe | Focus on future performance. | Reflect past performance. |
| Usefulness | Guides decision-making and strategy adjustments early. | Confirms overall success and accountability. |
What Are Real-World KPIs Examples?
KPIs vary by department, business function, or industry; they are metrics to measure your organization’s performance and success against an objective. We will now look at KPI examples for various major categories:
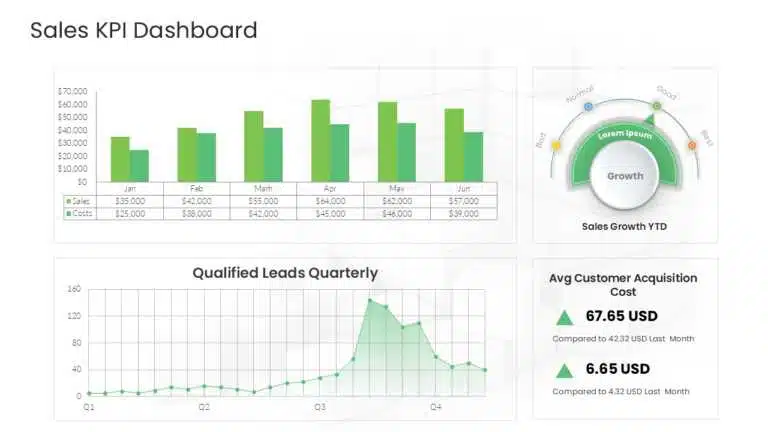
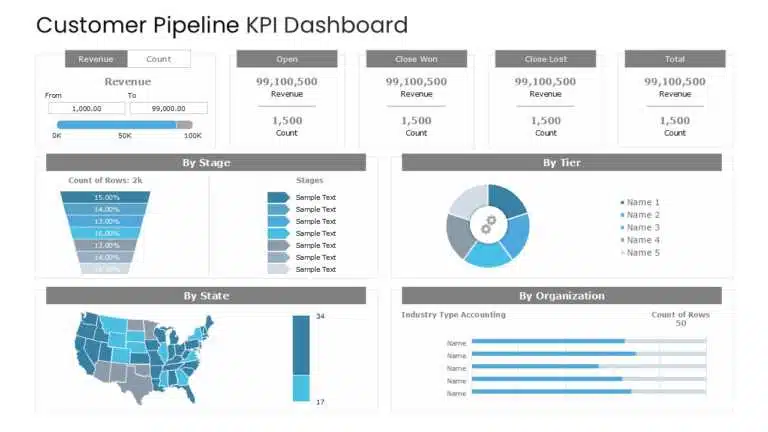
- Sales (KPIs )
- Sales KPIs are metrics measuring both your sales strategy and your sales team’s capabilities.
- KPI examples in Sales: Customer acquisition rate, revenue growth, conversion rates, average deal size, and sales cycle duration.
- Customer Service (KPIs)
- Customer service KPIs measure how successful your organization is at engaging and retaining customers, providing valuable insights into performance.
- Examples of KPI for customer service: Customer satisfaction score (CSAT), Net Promoter Score (NPS), average response time, and number of tickets resolved.
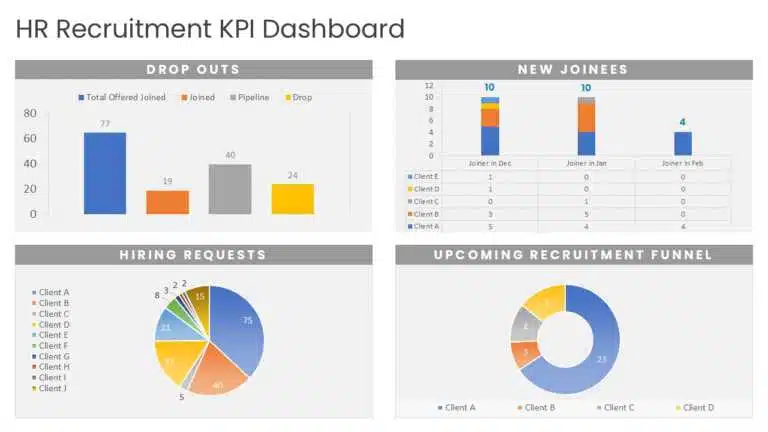
- Human Resources (KPIs)
- Human Resources KPIs are often metrics measuring employee engagement, productivity, and employee satisfaction, as well as employee retention.
- Some examples include: employee engagement scores, employee retention, turnover rate, absenteeism, time to hire, and training effectiveness.
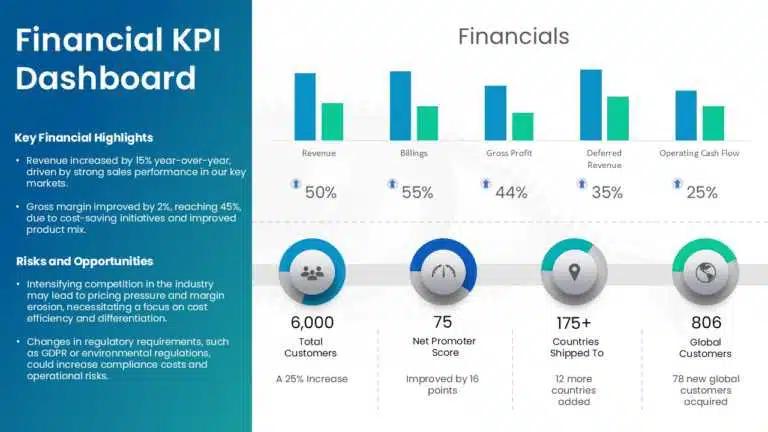
- Financial KPIs
- Financial KPIs analyze the overall financial health and performance of your business.
- Examples of KPI in Finance: Revenue growth, profit margin, market share, budget variance, cost per acquisition, and accounts receivable turnover.
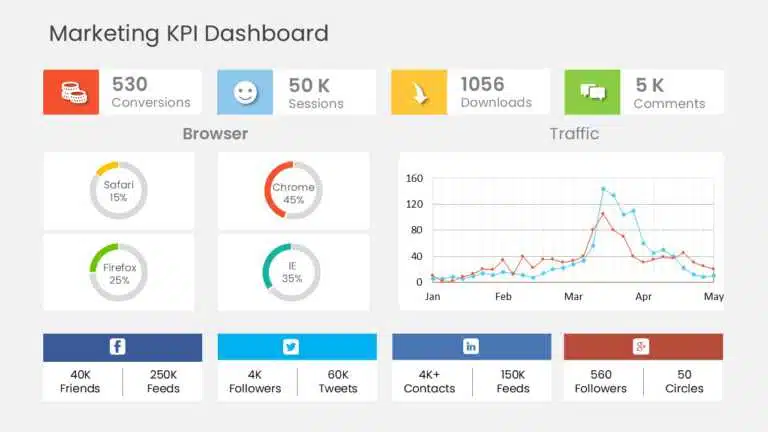
- Marketing & Social Media KPIs
- Marketing KPIs indicate how your campaigns drive awareness and engagement.
- Examples of KPIs in marketing: Brand awareness, market share, customer acquisition, website traffic, click-through rates, and social media engagement.
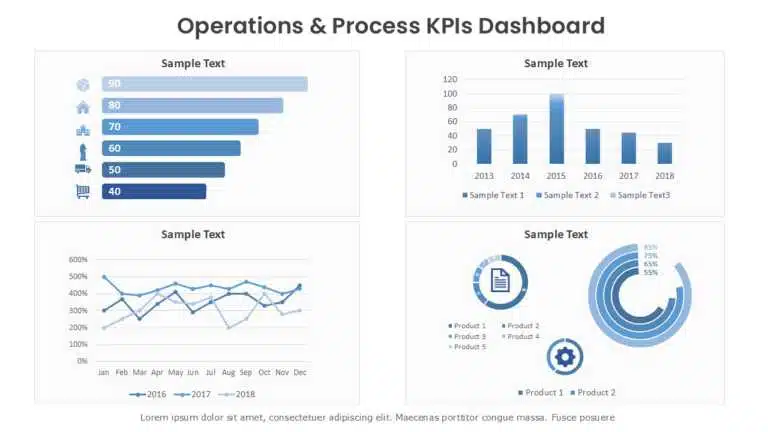
- Operations & Process KPIs
- Operations & Process KPIs assess efficiency, productivity, and process performance.
- Examples: Customer retention, overall process efficiency, production output, process cycle time, and resource utilization.
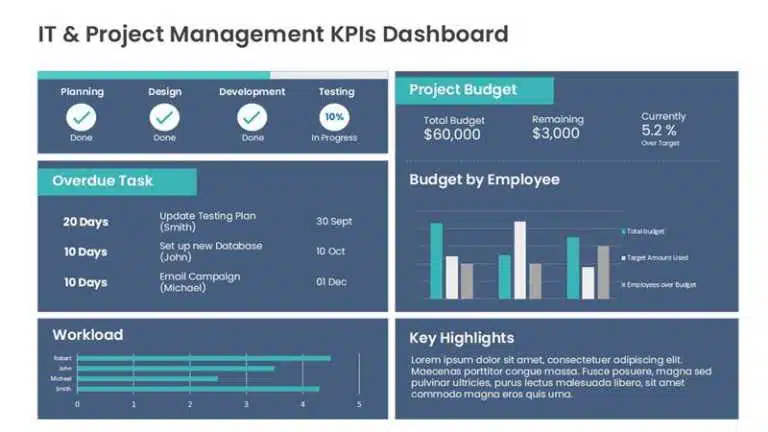
- IT & Project Management KPIs
- IT & Project Management KPIs assess the execution of projects and the performance of technology.
- Examples: Project completion rate, uptime, task completion rates, bug resolution time, and response time.
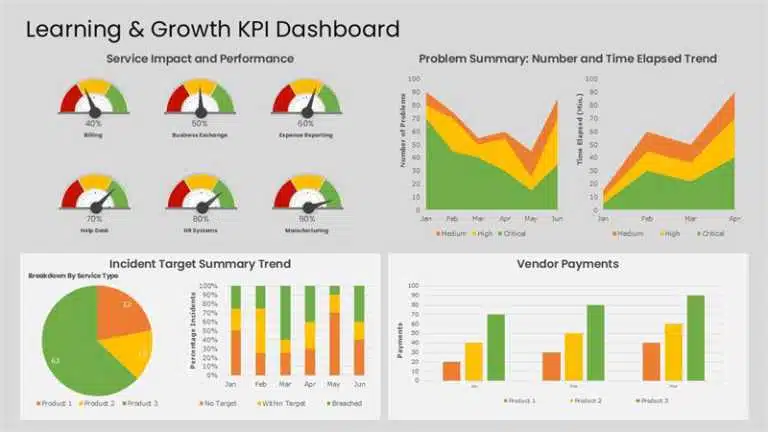
- Learning & Growth KPIs
- Learning & growth KPIs evaluate the rate of development for the organization as well as the development of its employees.
- Examples: Employee skills improvement, rate of innovation application, employee training hours, learning on completion, and pre-employment screenings.
Key takeaway: Selecting the most incisive KPIs ensures your organization’s efforts are aligned with its overall Smart goals. Tracking your KPIs will provide your organization with a clearer picture of how well it is performing, so decisions made will be properly informed and will contribute to organizational success.
What Should You Consider When Measuring KPIs?
When following KPIs, it’s vital that you track metrics that are meaningful, accurate, and actionable. Here are some important considerations to keep in mind:
- Align with Business Goals: Every KPI should represent movement in the direction of your organization’s goals. For example, if your goal is to make more sales, then track something different than social media likes.
- Clarity and Simplicity: KPIs should not be difficult for anyone to assess. Clear metrics eliminate confusion and are much more actionable to formulate insights upon, i.e., average time on page instead of a vague engagement score.
- The Accuracy of Data: KPIs are only as accurate as the data you are measuring. Once again, bad decisions based on bad data can steer your team in the wrong direction. Ensure your client management software (CRM) is updated prior to measuring sales conversion rates.
- Frequency of Measurement: Watch each KPI as often as it is applicable. Some metrics will require daily tracking, while others will be monthly or quarterly. For example, we may track our website traffic on a daily basis, while we may review customer retention on a quarterly basis, similar to how companies often highlight key metrics and trends in QBR examples.
- Do not Track Your KPI Without Action: Only track KPIs that will lead to deciding and acting on improvements. If a metric does not help you decide or take action, then don’t measure it. For example, if we measure our average customer response time, we should use insights to either help identify it or as an opportunity to fix bottlenecks.
- Set Benchmarks and Targets: Benchmarks are key to gauging performance. It is important to establish reference points to measure effective performance, i.e., reviewing the past month’s sales growth as a benchmark, or in comparison to an industry benchmark.
How to Develop and Choose KPIs: Step-by-Step Guide for How to Create KPIs?
Selecting the right KPIs is important for truly measuring performance and guiding your business to attain its specific goals. KPI development will include planning, alignment with objectives, and ensuring that the metrics you set are actionable. Here’s a step-by-step process to follow when developing KPIs that matter:
- Define Your Business Objectives:
- Begin by outlining the objectives your organization seeks to achieve. Metrics and KPIs that are aligned with those goals will provide meaningful tracking.
- For Example: If your goal is to increase customer satisfaction, a metric that may be relevant is your Net Promoter Score (NPS) or your average response time.
- Identify Critical Success Factors:
- Narrow in on the areas of your business that are mission-critical to achieving the set objectives. Decide on key performance indicators that will demonstrate you are making progress on these matters.
- For Example: For a sales-focused organization, potentially lead generation and conversion rates are key performance indicators for tracking qualified leads.
- Make Your KPIs Specific and Quantifiable:
- KPIs should be concrete, quantifiable, and trackable. Vague measures will lead to disinterest in tracking and misinterpretation of a lot of data.
- For Example: Anything like “increase of traffic to website” becomes form-specific metrics with numbers, like “increase organic traffic to the website by 20% next quarter”, etc.
- Make Sure They are Relevant and Actionable:
- Choose KPIs that your team can impact. If you cannot affect a metric, it will not be able to impact performance.
- For example: Training completion rate for employees is actionable, while overall market growth may be too vague or impacts by things your team cannot influence.
- Set Realistic Targets and Benchmarks:
- KPI should be challenging but realistic. You need to set benchmarks and targets in order to measure your performance effectively.
- For example: Set a monthly sales target based on the historical level of performance and trends in the market..
- Keep Things Simple and Balanced:
- Do not attempt to track too many KPIs at one time. Focus on a handful of KPIs that can give you a holistic view across different parts of the business.
What Are the Best Practices for Using KPIs Effectively?
Using KPIs to great effect means more than collecting data; it is about using KPIs strategically to improve performance and accomplish organisational goals. Here are a few helpful hints while developing and monitoring KPIs:
- Link your KPIs with your Strategic Objectives: Have every KPI fully aligned with your organisation’s strategic objectives. The last thing you need is a KPI that, even if it is successful, is not aligned, as that could lead to lost time and effort (not to mention lack of insight).
- As Simple and Clear as Possible: KPIs should be simple and clear to read for everybody in the team. Clear metrics make it easier to take action quickly, as everyone will understand indicators without confusion. Be sure they use time-based parameters too.
- Measurable and Quantifiable: Try to focus on metrics that are measurable to a high level of certainty. Do not track indicators that are vague; it does not lead to action. Beware of choosing indicators without actionable insights, too.
- Be Actionable: KPIs should also be actionable. Select KPIs that will provide your team with insights that can be directly influenced by their efforts. If it does not have implications for actions and decisions, then it may not be worth tracking.
- Make your targets realistic: KPIs should allow your team to work towards specific but realistic targets and benchmarks. The nature of KPIs is to inspire the team toward aspirational goals, but having targets should be reasonable, or else it may kill intrinsic motivation and accountability.
- Review and refresh on occasion: Organisations change; goals change; environments change. Check in regularly on your KPIs to see if they are still relevant and make changes where needed.
Utilise visualisation: The easiest way of using KPIs, which enhances insight, is through the use of dashboards, charts, and visuals. Visually summarising and reporting KPIs makes the indicators clearer to interpret, easier to assimilate, and allows the team to act faster.
FAQs
-
What is a KPI mean and why is it important in business?
A KPI (Key Performance Indicator) is a quantifiable value that indicates to the business how to track common KPIs toward an objective and how to assess the general performance of a company or individual. It allows a clear snapshot of how a business, team, or individual is achieving its goals. KPIs put the focus on matters of importance, allowing the company to make an intentional data-informed decision to achieve organizational growth or increased efficiency.
Why is it important:
- Tracks Progress: Helps marketers see if they are actually meeting established promotional business goals.
- Supports Data-Based Decisions: Leads to more actionable insights for better decision-making.
- Aligns Teams: Communicates clearly what everyone is working toward.
- Performance Accountability: Provides an easy view of performance results by the individual and teams.
- Improves Communication: Streamlines reporting to stakeholders with numbers defined.
-
Can you give simple KPIs examples?
- Sales: sales revenue per month, number of new customers acquired, customer conversion rate
- Customer Service: customer satisfaction score (CSAT), average response time, number of resolved support tickets
- Marketing: website traffic, usage/frequency in usage & engagement rates, open rates for emails
- Finance: profit margins, budget variance, accounts receivable turnover
- Human Resources: employee turnover rate, training completion rate, employee engagement score
- Operations: overall production output, process cycle time, on-time delivery rate,
- Project Management: project completion rate, task completion rate, and number of delays related to the project
-
What is KPI Formula?
There isn’t one universal KPI formula because KPIs vary by goal, but most KPIs follow a basic structure:
KPI= Specific Metric (Actual Value)Target or Benchmark 100
The formula always depends on what you want to measure—but the logic is the same: compare actual performance against a target or baseline.
-
How do I choose the right KPIs for my company?
- Align with Business Goals: Select KPIs that directly reflect your company’s objectives.
- Focus on Critical Success Factors: Track the areas that have the biggest impact on achieving goals.
- Make Them Measurable: Ensure KPIs are quantifiable and easy to track.
- Keep Them Actionable: Choose metrics your team can influence and improve.
- Set Realistic Targets: Define achievable benchmarks to evaluate performance effectively.
- Limit the Number: Focus on a few key metrics to avoid overwhelming your team.
- Review Regularly: Update KPIs as business goals and priorities evolve.
-
What are the main types of KPIs used in organizations?
- Quantitative KPIs: Measurable numeric metrics, like sales revenue or website traffic.
- Qualitative KPIs: Subjective metrics based on opinions or feedback, like customer satisfaction.
- Leading KPIs: Predict future performance and help take proactive actions, such as the number of new leads.
- Lagging KPIs: Measure past performance and outcomes, like quarterly revenue.
- Strategic KPIs: Focus on long-term organizational goals, like market share or brand awareness.
- Operational KPIs: Track day-to-day performance and efficiency, like production output or average response time.
-
How can Neo help in presenting KPIs effectively?
Neo is an AI presentation maker tool that helps teams create professional, data-driven presentations quickly. When it comes to KPIs, Neo can:
- Visualize KPIs Easily: Automatically turn KPI data into charts, graphs, and dashboards for clear reporting.
- Save Time on Design: Use AI to generate visually appealing slides without manual formatting.
- Enhance Stakeholder Communication: Present complex KPI metrics in an easy-to-understand and engaging format.
- Maintain Consistency: Ensure all KPI reports follow a consistent style and branding across presentations.
Key takeaway: Using Neo, businesses can turn KPI insights into polished presentations quickly, making it easier to communicate performance and strategy effectively.
-
What are KPIs for project management?
Project management KPIs help track the performance and success of projects, ensuring they stay on schedule, within budget, and meet objectives. Common examples include:
- Project Completion Rate: Percentage of tasks or milestones completed on time.
- Budget Variance: Difference between the planned budget and actual spending.
- Schedule Adherence: Measures whether the project is progressing according to the timeline.
- Resource Utilization: Tracks how effectively team members and resources are used.
- Number of Delays or Issues: Counts project bottlenecks, risks, or obstacles encountered.
- Quality Metrics: Measures project outputs against defined quality standards.
- Customer/Stakeholder Satisfaction: Evaluates satisfaction with project results or deliverables.
-
What are the 4 P’s of KPI?
The 4 P’s of KPI are a framework to ensure that key performance indicators are well-defined, effective, and actionable. They are:
- Purpose – Defines why the KPI exists and what it aims to achieve. Example: Measuring customer satisfaction to improve service quality.
- Performance – Focuses on what is being measured and the level of achievement. Example: Tracking monthly sales revenue to evaluate sales team performance.
- Perspective – Provides context by showing how the KPI relates to business objectives. Example: Customer retention rate linked to long-term business growth.
- Position – Indicates who is responsible for the KPI and where it fits within the organization. Example: Marketing team responsible for website traffic and lead generation KPIs.
Key takeaway: The 4 P’s framework ensures KPIs are clear, aligned, and actionable, helping organizations track meaningful performance metrics effectively.
-
What makes a good KPI for Project Management?
A good KPI for project management should be relevant, measurable, and actionable to ensure projects are on track and aligned with business goals. Key characteristics include:
- Aligned with Project Goals: Directly reflects the objectives of the project. Example: Tracking task completion rate to measure progress toward project milestones.
- Specific and Measurable: Provides clear, quantifiable data. Example: “Reduce project delays by 10%” is measurable, while “improve efficiency” is vague.
- Actionable: Offers insights that the team can act upon to improve performance. Example: Monitoring resource utilization to adjust workloads and prevent bottlenecks.
- Time-Bound: Includes a timeframe to evaluate progress effectively. Example: Weekly tracking of milestone completion or monthly budget adherence.
- Relevant to Stakeholders: Provides value to both project managers and stakeholders for decision-making. Example: Stakeholder satisfaction scores to evaluate the quality of project deliverables.
- Easy to Communicate and Understand: Should be simple for all team members to interpret. Example: Visual dashboards showing percentage completion or budget spent vs. allocated.
-
How have KPIs evolved over time in business management?
KPIs have changed a lot over the years in how people run businesses. In the past, most KPIs were simple numbers that showed whether a company made money or not. Now, KPIs look at more things. They can show how happy buyers are or how well teams work together. Today, tools help people see this data faster and easier. As time goes on, KPIs keep changing to match new needs in business. This helps companies make better choices and reach their goals.
Table Of Content


Related posts from the same category

18 May, 2021 | SlideUpLift
The 5 Essential PowerPoint Themes For Project Managers
As a project manager, making presentations is an integral part of your job. Making a good presentation requires many elements to be successful, with good presentation design being one of

16 Dec, 2021 | SlideUpLift
Breaking Down Work Breakdown Structure in Easy Steps : Must Have Resource For Project Managers
Project management is complex. It necessitates keeping track of multiple – sometimes geographically dispersed – teams, coordinating tasks, and holding everyone accountable to a common goal. Fortunately, there are a

8 Jul, 2021 | SlideUpLift
Avoid Making These 7 Project Management Mistakes
Making mistakes is not a bad thing; tons of lessons can be learned from them. And in the field of Project Management, lessons abound. Projects, unfortunately, seldom go smoothly. There

13 Oct, 2022 | SlideUpLift
Traditional Vs. Agile Project Management: Key Differences
The debate between Agile and Traditional methodologies has been ongoing in every business size. Each approach comes with principles, practices, and philosophies catering to different project requirements. Traditional and Agile

15 Apr, 2021 | SlideUpLift
5 Most Popular Agile Project Management Frameworks
Agile frameworks strongly emphasize collaboration and open communication within project teams. Regular events such as daily meetings, sprint planning, and retrospective sessions facilitate ongoing discussions and ensure everyone is on

24 Apr, 2024 | SlideUpLift
How To Create A Project Timeline For Efficient Project Management
Just like a road trip needs a detailed map with turns, stops, and estimated travel times, every project needs a plan. A project timeline acts as your roadmap, giving you

15 Apr, 2021 | SlideUpLift
11 Best Visual Roadmap Ideas & Design Trends for 2026
This blog shares the best roadmap examples and PowerPoint roadmap templates for presenting plans, timelines, and goals clearly. It explains different roadmap styles and when to use them. The guide

21 Dec, 2023 | SlideUpLift
Top 10 Project Management Presentation Topics
Project Management Presentation Topics are a range of subjects related to efficiently managing projects. The topics cover different aspects. These include planning methods, team collaboration, risk management, leadership, and emerging

31 Oct, 2022 | SlideUpLift
The Savvy Project Manager Series: 5 Steps To Successful Project Planning
We encounter projects in our everyday lives. You might be building or contributing to a deliverable like a report, a website, a tool, or a product. These are real projects

10 Oct, 2025 | SlideUpLift
What Is A Project Charter? Definition, Examples & Best Practices
Launching a project without adequate planning can result in confusion, delays, and misaligned expectations. A project charter is a key document in the project documentation process that lays the groundwork