
How To Make A Flow Chart In Google Slides [Quick Flow Chart Guide]
Presentations are crucial in conveying information with clarity and precision, whether presenting a complex project plan, outlining a new business process, or explaining a series of decision-making steps. One highly used method for enhancing business communication is a flowchart. To help your audience understand concepts through steps, you should learn how to make a flow chart in Google Slides.
A flowchart, rather than a technical document or thorough explanation, visually describes a process, making it easy to understand. You can create a flowchart in Google Slides using three simple methods, which we will discuss in this blog. Let’s dig deeper and understand how to make a flowchart in Google Slides.
What Is A Flowchart

A flowchart is a diagram that showcases different aspects of a sequence or process. It shows how various elements “flow” together to form a final product. It offers a visual, step-by-step method for identifying and describing actions that must be taken to accomplish specific goals. It helps in process visualization, tracking development, and communicating the connections between various phases and outcomes within a predetermined procedure.
Flowcharts use rectangles, ovals, diamonds, and many other shapes to indicate the type of step, as well as linking arrows to represent flow and sequence. They can be as basic as hand-drawn charts or as complex as computer-drawn schematics illustrating several steps and paths. Hence, you need to learn how to make a flow chart in Google Slides.
Applications Of A Flowchart
Below are some of the examples where you can use flowcharts:
Business And Project Management
- Outline project timelines and task dependencies.
- Visualize decision-making processes within an organization.
- Illustrate workflow management and process optimization.
- Present organizational hierarchies and reporting structures.
Healthcare And Medicine
- Visualize drug development and clinical trial processes.
- Illustrate medical diagnoses and decision trees.
- Create anatomical diagrams and healthcare workflows.
- Present surgical procedures and preoperative checklists.
Information Technology
- Create network and system architecture diagrams.
- Explain troubleshooting and technical support workflows.
- Illustrate cybersecurity incident response plans.
- Design data migration and data flow diagrams.
- Outline IT infrastructure and cloud migration processes.
Education And Training
- Visualize student learning paths and assessment rubrics.
- Explain educational research methodologies.
- Outline teacher training and professional development.
- Create academic advising and student support workflows.
- Explain institutional accreditation and assessment procedures.
How To Make A Flow Chart In Google Slides
Making a Google Slides flowchart is simple. There are two primary ways to create a flow chart in Google Slides:
- Using Pre-made Diagrams
- From Scratch
- Using SlideupLift’s Templates
How To Make A Flow Chart In Google Slides Using Pre-Made Diagrams?
Using diagrams to make a flowchart in Google Slides is a straightforward process. Google Workspace provides easy-to-use, customizable diagrams. Follow the steps below on how to create a flow chart in Google Slides:
- In your Google Slides presentation, go to the “Insert” menu > select “Diagrams.” A second window will appear on the right side of your screen.
- Click on the “Process” option. You’ll get five distinct process diagram designs, including stairs, pyramids, and linear diagrams. For circular or repetitive processes, look at the choices under the “Cycle” option.
- After selecting the layout, you can edit it before adding the flowchart to your presentations.
- Go to the “Steps” option to add up to five phases to your flowchart and the “Color” option to alter the colors to suit your presentation best.
- Once your flowchart is customized, pick the layout you wish to integrate into your slides. Edit the content by typing in the text fields that you’ve selected.
TIP: You can now make more changes to your flow chart Google Slides layout. You can edit and format text, and the font, style, and color can all be modified. Selecting each form/shape can further alter how it appears in your flowchart Google Slides.
YOU MIGHT ALSO NEED: How To Wrap Text In Google Slides?
How To Make A Flow Chart In Google Slides From Scratch?
You can create a flowchart directly in your Google Slides presentation for whatever purpose you want to use it. As a result, you will have more control over the number of stages and the format of your flow chart Google slides. Follow the steps below on how to create a flowchart in Google Slides from scratch:
- Go to “Insert”> “Shape”> “Shapes”. You can use various shapes to represent the steps in your flowchart.
- Double-click to insert the shape you desire for your flowchart onto your slide. You can drag the shape, move it about your slide, and change it using the anchor points. Use the “Shape” menu to change the color and outline of your shape.
- Repeat these steps to create all the shapes required for your flowchart.
- Arrange your shapes using the “Arrange” option. You can divide your shapes evenly spaced apart or ensure they are aligned.
- Select the arrow that best meets your needs by going to “Insert”> “Shape”> “Arrows”. To fit the shape with your existing shapes, use its anchor points.
At this point, you should add arrows to give the flowchart Google Slides a step-by-step feel. And now you have a flowchart created in Google Slides! Try experimenting with the layout and color scheme to make it appear more finished.
How To Make A Flow Chart In Google Slides Using SlideUpLift’s Templates?
We discussed the two primary options for creating flowcharts in Google Slides. Creating presentations from scratch is usually time-consuming, as you have to put together every design piece on your own. Pre-made diagrams offer limited choices in terms of creativity. Hence, we have got another effective method for you. You can use SlideUpLift’s templates to create personalized Google Slides flow charts for your presentations and meetings.
SlideUpLift offers multiple templates for all types of presentations for individuals and business professionals from various backgrounds and industries. All the templates can be customized as per your choice. Let’s discuss how to make a flow chart in Google Slides using templates. Follow the below steps:
- Visit Slideuplift.com and search for “flowchart templates.”
- Browse hundreds of templates and choose the one that best fits your requirements.
- Download it in Google Slides format. Depending on your requirements, you may choose the 4*3 resolution or 16*9.
- Open it in Google Slides. The presentation will have multiple placeholders, which are fully editable, so you can change the text and other elements.
- Customize the template by filling in your data, colors, images, and any other graphical element you want.
- Review the changes and save the presentation to use in your meetings.
How To Insert Flow Chart In Google Slides?
You learned how to make a flow chart in Google Slides. But what if you already have a flow chart and you want to incorporate it into your presentations? Follow these steps below to insert a flowchart Google Slides:
- Open the document containing the flowchart. Right-click the flowchart slide in the thumbnail portion on the left side of the screen and select “Copy.”
- To add the flowchart slide to your presentation, locate the thumbnail part and right-click > “Paste.”
- When you insert your flowchart slide into your presentation, a format window will appear. You can choose from various designs for the imported slides.
PRO TIP: If you want the slides to remain exactly how you copied them, select “Keep original styles.” On the other hand, select “Match styles” in this presentation if you want the imported slide to match the presentation’s style.
How to Insert a Flowchart from PowerPoint
What if you already have a flowchart in a PowerPoint presentation and your other presentation, which you will use in your meetings, is in Google Slides? It would be best to refrain from creating it all over again in Google Slides. In that case, you can insert it into your Google Slides. Follow the below steps on how to make a flow chart in Google Slides by inserting it from PowerPoint:
- Go to your Google Drive account, choose the “New” option, and click “File upload.”
- Choose the PowerPoint presentation you want to insert and upload.
- After it is uploaded, double-click and open it. Navigate to the “open with” option and choose “Google Slides.”
- Now, you have your PowerPoint presentation in Google Slides format.
How To Edit A Flow Chart In Google Slides?
It’s time to alter the flow chart you just added to your Google Slides presentation, whether you built it yourself or imported it from another source. You can find some advice to assist you in improving your Google Slides flow chart here:
- You can choose the Fill color by clicking the bucket symbol. The colors can be altered, made translucent, or have gradient tones.
- The other three options allow you to choose the color, weight, and dash of each shape’s border lines.
- Changing the text’s style will also make your flow chart appear more professional. Remember that it should still be simple enough for your audience to read.
- The Arrange menu can change anything. It will help you ensure that the shapes in your flowchart are evenly spaced and aligned.
- You can include icons for extra visual appeal if you want your flowchart to be more memorable for your audience and more straightforward to follow at first sight.
These suggestions helped you learn how to make a flow chart in Google Slides.
ALSO READ: How to create a flowchart in PowerPoint?
Best FlowChart Templates From SlideUpLift
Here are some top FlowChart templates from SlideUplift that you can use:
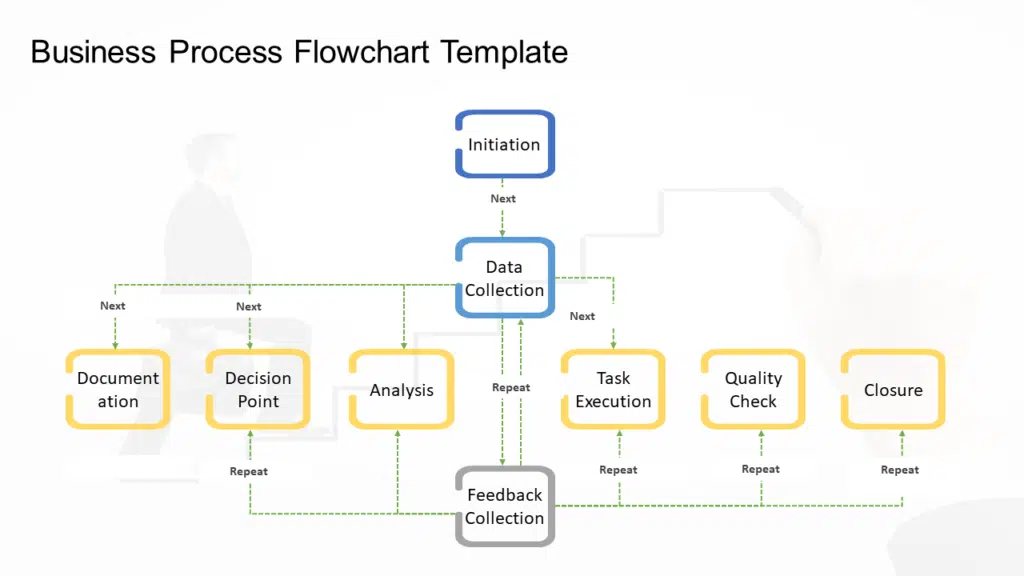
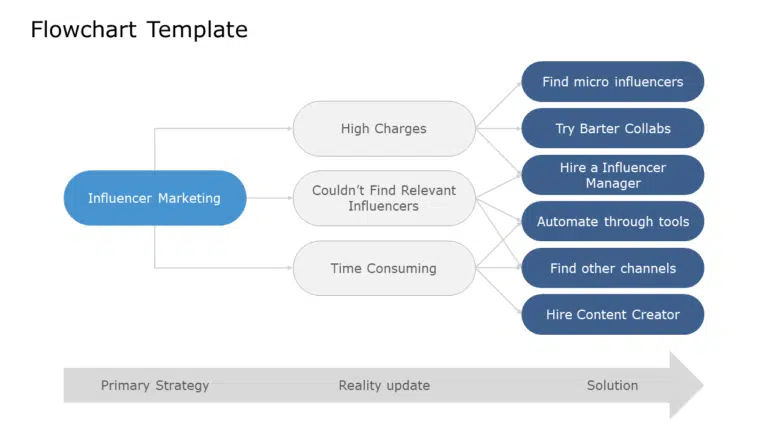
Business Process Flow Chart
This template is perfect for mapping detailed business processes and workflows. It features a variety of shapes and connectors to effectively illustrate the flow of steps.
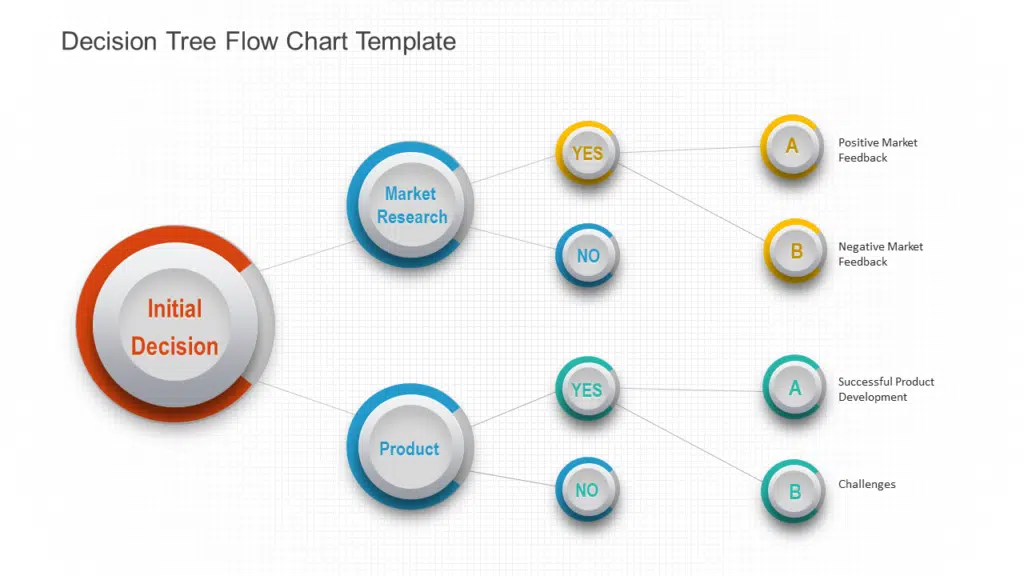
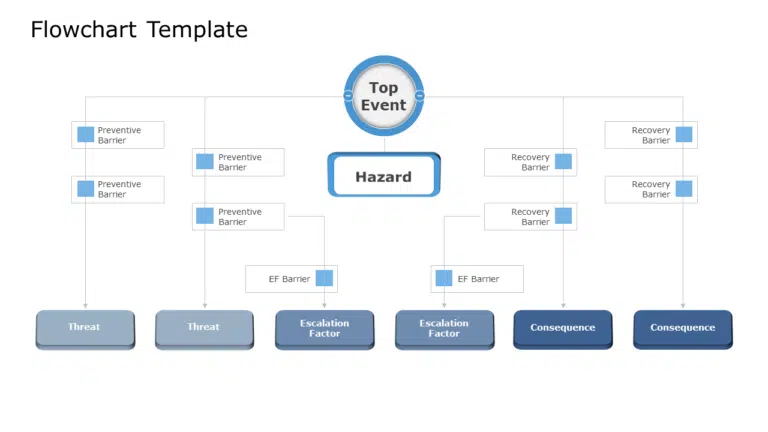
Decision Tree Flow Chart
This template offers a straightforward and visually engaging design for decision-making processes and shows various outcomes, helping users present complex choices more effectively.
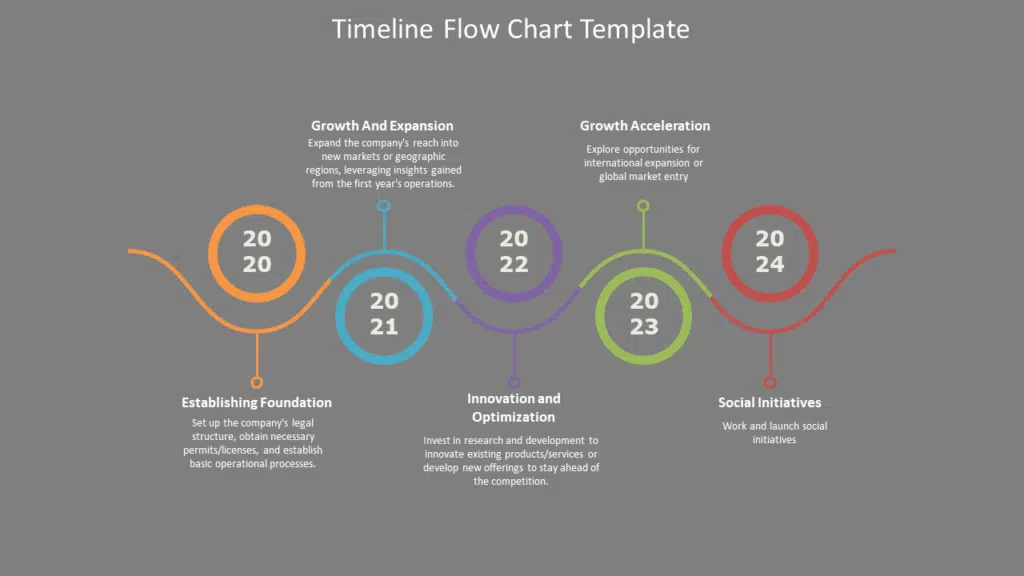
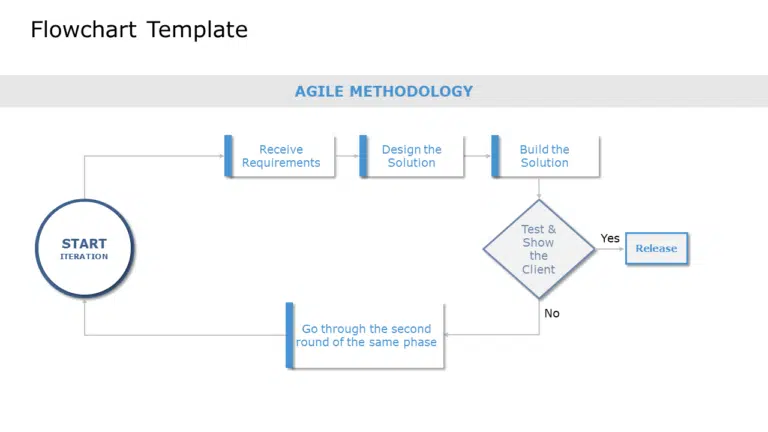
Timeline FlowChart
Ideal for project planning, this template provides a timeline-style flowchart to visualize the sequence of events and deadlines. It’s excellent for tracking milestones and deadlines.
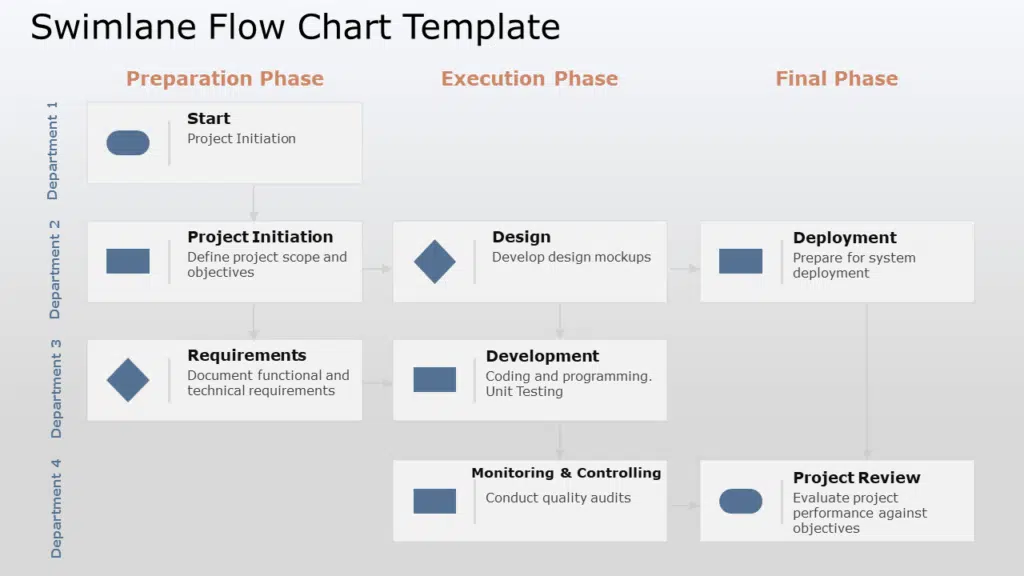
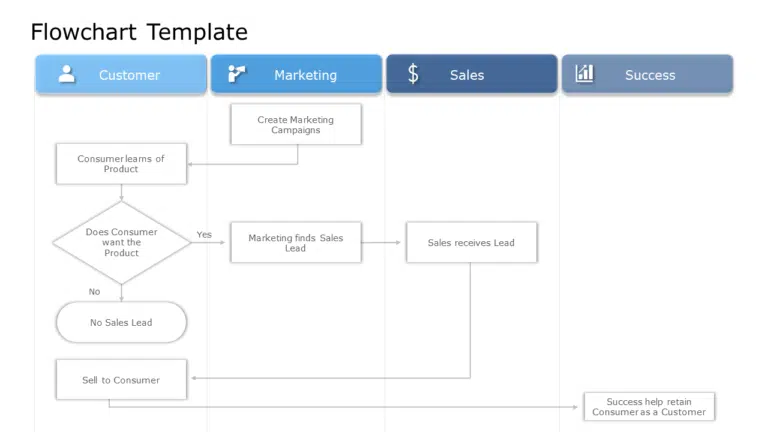
Swimlane FlowChart
When depicting responsibilities within a process is essential, the swimlane template is a valuable tool. It clearly shows who is accountable for each step in a flowchart.
Flowchart Templates Collection

Conclusion
This blog helped you learn various methods of how to make a flow chart in Google Slides. The detailed step-by-step guide will help you make outstanding presentations. SlideUpLift provides you with downloadable flowchart template designs with solid features. Flowchart templates from SlideUpLift are indispensable resources for businesses and professionals.
FAQs
-
Are SlideUpLift’s Flowchart Templates Easily Customizable?
Yes, SlideUpLift’s flowchart templates are fully customizable, allowing you to adjust colors, fonts, and styles to align with your presentation themes and branding.
-
How To Make A Flow Chart In Google Slides?
You can also create a flowchart in Google Slides from scratch.
- Click “Insert” > “Shape” > “Shapes” > select any shape and start editing.
- Arrange the shapes using “Arrange”.
- Go to “Insert” > “Shape” > “Arrows”. Select the arrow that best meets your needs.
-
What Are The Best Practices For Effectively Using Flow Charts In Google Slides?
Ensure your flow charts are well-organized, use consistent design elements, and explain each step clearly to maximize their impact in presentations.
-
How Can I Share My Flowchart With Others Or Present It?
You can easily share your flowchart with your team by simply following this step:
- Click the “Share” button in the top-right corner to collaborate with others.
- Also, use the “Present” button to give a live presentation of your flowchart.
Table Of Content


Related posts from the same category

19 Mar, 2024 | SlideUpLift
How To Make A Flow Chart in PowerPoint Presentation?
Imagine standing in front of an audience with a brilliant idea but struggling to get it across the board. The words are rolling off your tongue, yet your concept remains

29 Dec, 2023 | SlideUpLift
How to Make Checkboxes in Google Slides?
Google Slides is one of the most widely used presentation tools today. It is used for creating simple text and picture presentations and complex presentations. You can create surveys and

8 Dec, 2023 | SlideUpLift
How to Make a Chart in Google Slides Presentations?
Charts and graphs are essential components of statistics. They are the most effective means of visually representing the slow deterioration of a state or its progressive advancement. For instance, Google

12 Jun, 2025 | SlideUpLift
Create An Org Chart in Google Slides: A Step-by-Step Guide
Want to map out any type of organizational structure—whether it's a company, project team, or even a hierarchy? An org chart helps visualize relationships between roles, departments, or functions in

27 Dec, 2023 | SlideUpLift
How To Insert A Calendar In Google Slides?
Google Slides, a powerful cloud-based presentation tool, offers a variety of features to enhance your slideshows and engage your audience. One such feature that can significantly improve your presentation is

29 Mar, 2024 | SlideUpLift
Google Slides Tips and Tricks 2024: How to Make Google Slides Look Good?
Google Slides is a go-to tool for making outstanding presentations, thanks to its user-friendly interface, accessibility from anywhere, and easy collaborative options. It improves presentation skills regardless of whether you're

12 Sep, 2022 | SlideUpLift
How To Make Google Slides Vertical
While building/presenting a presentation on Google Slides, presenters often have this question- How to change Google slides to portrait? This query not only includes the standard 4:3 slide design, but

1 Dec, 2022 | SlideUpLift
How to Add a Border in Google Slides
Google Slides is an incredible presentation tool that enables you to craft proficient, eye-catching business presentations. This tool offers users a variety of ways to enhance their presentations, including the

12 Feb, 2024 | SlideUpLift
How To Make Columns In Google Slides? [Step-by-Step Guide]
In Google Slides, columns can be quite helpful in a presentation's objective of clearly communicating and visualizing content for the audience. Columns help to maximize space utilization and arrange presentation

24 Jan, 2024 | SlideUpLift
How To Insert A Fraction in Google Slides?
Google Slides is not just a versatile tool for conveying ideas and strategies but also numbers and complex data. Some numbers and data are part of advanced equations, including fractions.