Flat 1


 Edit with AI
 Ask Us To Edit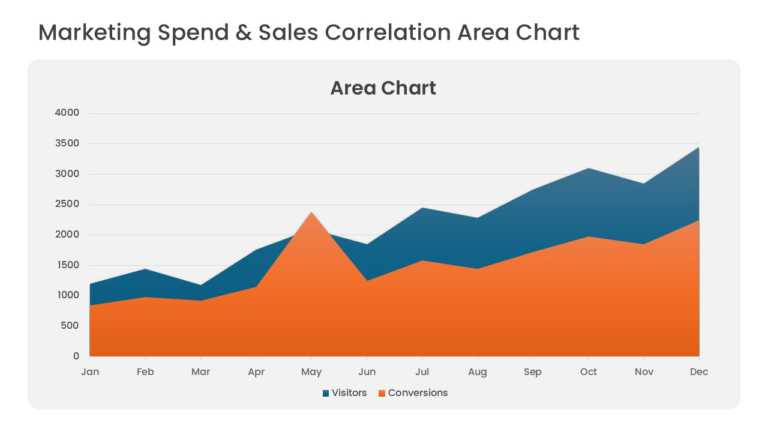

Product Description:
Overlapping area series compare marketing spend with sales revenue over consecutive periods. Translucent fills keep both series visible where they intersect, so viewers can see how revenue responds after changes in spend.
For a budget allocation review, marketing analytics leads can use the chart to demonstrate return on marketing investment and support scaling the channels that paid back.
Find more sales analysis templates for commercial reporting, or compare chart options in our guide to chart types and their uses. Labels, values, and colors are editable in PowerPoint and Google Slides.