Flat 1


 Edit with AI
 Ask Us To Edit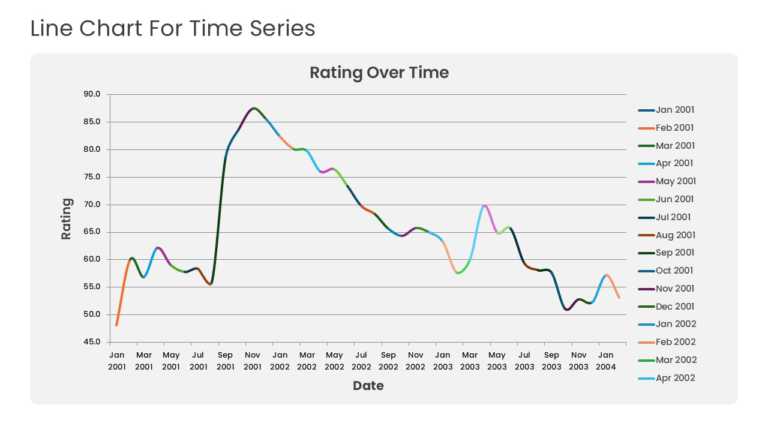

Product Description:
Multiple years of historical data run across a time-series line graph with point markers and gridlines. The layout highlights baseline momentum, seasonal patterns, and the projected growth path.
Financial analysts preparing an annual shareholder briefing can use the graph to explain long-term performance and show how the forecast follows from past results.
See more line graph templates, or build your own version with our step-by-step guide to making a graph in PowerPoint. Available for PowerPoint and Google Slides with fully editable labels and values.