 Fall Sale
 Flat 40% off on our Unlimited Access Yearly Membership plan!

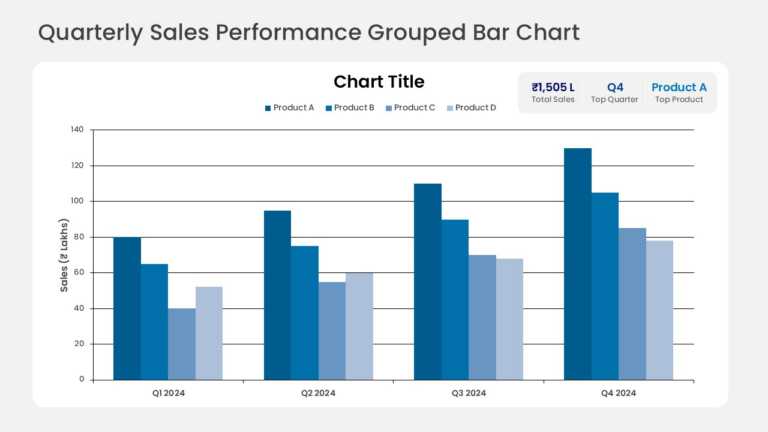
Grouped columns compare quarterly sales across several product lines, with one column per product in each quarter. KPI callout cards above the ch....


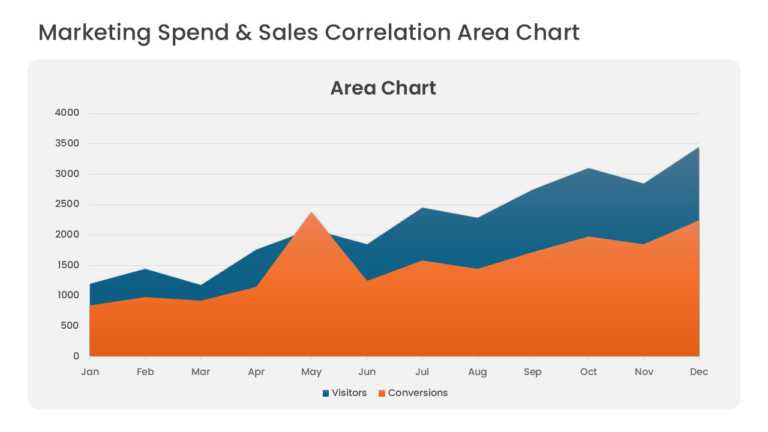
Overlapping area series compare marketing spend with sales revenue over consecutive periods. Translucent fills keep both series visible where the....
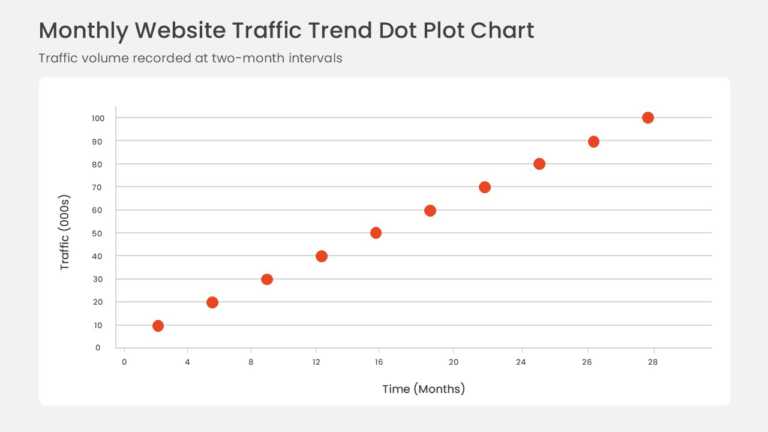
Data points plotted on horizontal and vertical axes form a scatter plot with a fitted linear trendline. The rising pattern shows a positive corre....
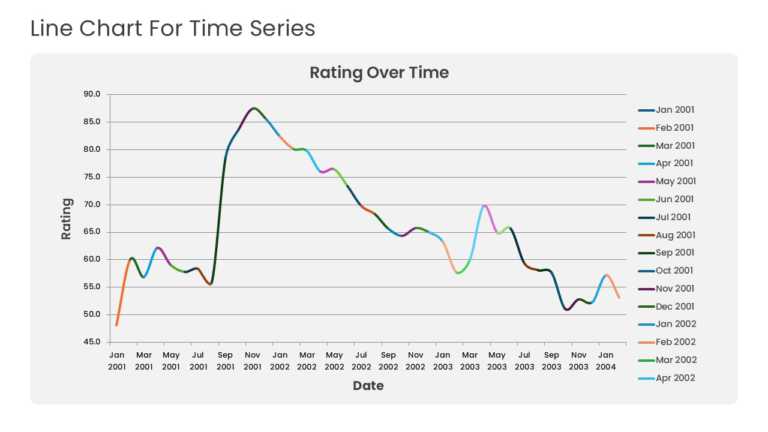
Multiple years of historical data run across a time-series line graph with point markers and gridlines. The layout highlights baseline momentum, ....
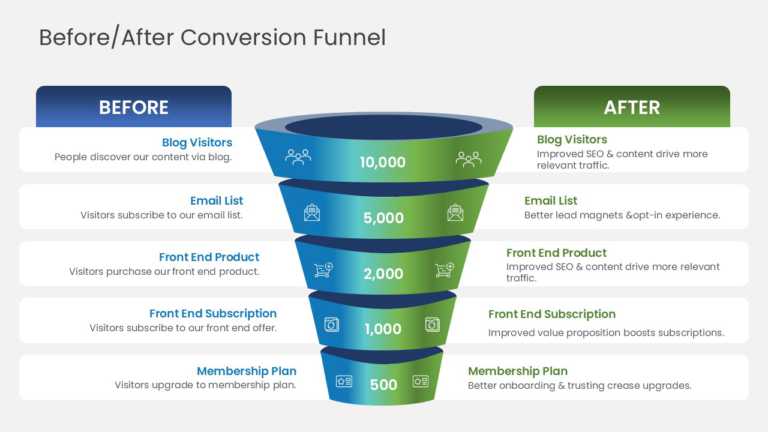
Baseline and optimized conversion paths are compared across a five-stage funnel diagram. Stages run from blog visitors and email subscribers to f....

A presentation deck that sales professionals use to visualize and communicate sales strategies. This deck helps in the proper planning and execut....

Make informed decisions with our Actual vs Forecast template. It can be used to compare actual results in comparison to projected performance. Pr....

Use this template to compare actual results in comparison to projected or forecasted performance. It can be used to visualize and analyze revenue....

This after-sales management strategy template is perfect for professionals working in sales, logistics or operations departments. It covers all t....

A perfect sales strategy deck for professionals who are looking for effective planning and execution of their sales strategy. It can be used to v....

Effectively strategize, plan, and communicate the key points of your sales strategy with the help of this modern and aesthetic presentation deck.....

This presentation theme is specially designed for professionals wanting to visualize and communicate customer value proposition strategies in a m....
Related Presentations
-

Demand Creation
8 templates>
-
Operations
84 templates>
-
Sales Plan
366 templates>
-
Business
6,541 templates>
-
SWOT Analysis
131 templates>


