

How to Create Harvey Balls in PowerPoint: A Complete Step-by-Step Guide
Quick Answer: What Are Harvey Balls and How Do You Create Them?
Harvey Balls are circular ideograms — partially filled circles — used to represent qualitative data such as project completion, product ratings, or satisfaction levels at a glance.
To create a Harvey Ball in PowerPoint:
- Insert tab → Shapes → Oval (hold Shift to make a perfect circle)
- Insert tab → Shapes → Partial Circle (same size, hold Shift)
- Layer the partial circle on top of the full circle
- Adjust the fill angle using the yellow dot handles
- Select both shapes → Right-click → Group → Group (or Ctrl+G)
Three creation methods: Manual Shapes | Built-in Icons | Segoe UI Symbol Font
Introduction
Adding quantitative data to presentations — numbers, metrics, and statistics — is straightforward. But how do you communicate qualitative information, like product quality, project health, or employee performance, in a way that is fast to read and visually clear?
That is exactly what Harvey Balls are designed for. Used by management consultants at McKinsey, BCG, and Booz Allen Hamilton, Harvey Balls are one of the most efficient tools for representing qualitative data in comparison tables, project dashboards, and business reports. Whether you are creating Harvey Balls in PowerPoint for the first time or refining an existing template, this guide walks you through every method.
This guide covers everything: what a Harvey Ball is, when to use them, three methods to create them in PowerPoint, ready-made Harvey Balls templates, and pro tips to keep your visuals polished and professional.
What Are Harvey Balls?
Harvey Balls are round ideograms — circles filled to varying degrees — used to communicate qualitative information such as ratings, progress, or completion status, most commonly in comparison tables. Each ball is a circle filled to a specific degree, where the level of shading communicates the level of completion, satisfaction, performance, or importance of a given attribute.
They were originally developed by Harvey L. Poppel at Booz Allen Hamilton in the 1970s, which is why they are also sometimes called Booz Allen Hamilton balls or simply Booz Balls. Today, a Harvey Ball is a standard visual tool in management consulting, project management, HR, and financial reporting.
A fully filled circle indicates maximum completion or high performance. An empty circle represents the lowest level — incomplete or unsatisfactory. The states in between allow for a nuanced, at-a-glance comparison without the cognitive load of reading numbers or text.
Standard Harvey Ball Fill Levels
| Level | Fill | Meaning / Use |
|---|---|---|
| Empty | 0% | Not initiated / No completion |
| Quarter | 25% | Early stage / Just started |
| Half | 50% | Partially complete / In progress |
| Three-Quarter | 75% | Mostly complete / Near done |
| Full | 100% | Fully complete / Maximum achievement |
The ideal number of segments is four to five. Too many levels introduce confusion; too few reduce the value of the comparison.
Advantages of Using Harvey Balls in PowerPoint
Harvey Balls offer distinct advantages over text or numerical tables when presenting qualitative data in your slides:
- Save slide space: Replace dense data tables with compact visual symbols that communicate the same meaning in a fraction of the space.
- Visualize qualitative data: Represent attributes that cannot be easily quantified — like taste, usability, or work ethic — without forcing them into numerical scales.
- Communicate efficiently: Audiences scan Harvey Balls faster than reading text or parsing numbers, making it easier to spot trends, patterns, or outliers.
- Enhance engagement: Graphical representations hold attention better than plain data, improving information retention.
- Flexible and customizable: Harvey Ball icons can be adjusted in size, color, and shading to fit your presentation theme or highlight specific data points.
- Bridge language barriers: As visual symbols, Harvey Balls communicate across languages, making them effective in international or multilingual business contexts.
When to Use Harvey Balls in Presentations
From project status dashboards to Harvey Ball analysis in risk reports, there are many scenarios where these visuals demonstrate clear advantages over plain text or numerical tables. Here are the most common use cases:
1. Project Status Reporting
Show the completion status of different project components — planning, development, testing, deployment — at a glance. Stakeholders can understand where a project stands across multiple dimensions in seconds, without reading detailed project status report templates. Using Harvey Balls for project updates is standard practice in management consulting and agile project management.
2. Product Comparisons
Compare products or services across qualitative criteria like price competitiveness, user experience, quality, and safety. Unlike check marks that only indicate yes/no, Harvey Balls allow for degrees of comparison — making them ideal for nuanced product analysis. A Harvey Ball chart is especially effective here when used inside comparison tables.
3. HR and Employee Performance Reviews
Rate employees across multiple dimensions such as performance, potential, teamwork, and work ethic. Harvey Balls provide a consistent, visual, and less text-heavy method for presenting evaluation data to management. This type of Harvey Ball analysis helps HR professionals communicate holistic assessments without lengthy written commentary.
4. Sales and Financial Reporting
Use Harvey Balls in financial dashboards to show relative performance across business units, time periods, or KPIs. A filled circle signals strong performance; a partially filled one highlights areas needing attention. This makes them a practical tool for executive-level financial reporting.
5. Risk Assessment
Indicate risk levels across different categories, showing both likelihood and impact. Decision-makers can quickly identify high-priority risks without wading through numerical scoring matrices.
6. Survey and Feedback Analysis
Summarize responses to qualitative questions or rating scales. Harvey Balls can represent the distribution of answers across satisfaction levels or agreement scales, making feedback data easy to scan and act on.
How to Create Harvey Balls in PowerPoint: 3 Methods
There are three proven methods for creating Harvey Balls in PowerPoint. Method 1 (Manual Shapes) works in all PowerPoint versions and gives you the most control. Methods 2 and 3 are faster but have version or font dependencies.
Method 1: Manual Shapes — Create Harvey Balls in PowerPoint from Scratch
This is the most reliable way to create Harvey Balls without any add-ins or special fonts. It works in PowerPoint 2013, 2016, 2019, Microsoft 365, and all recent versions.
- Go to the Insert tab in the top ribbon. Click Shapes and select the Oval shape. Hold Shift while drawing to create a perfect circle.
- With the circle selected, open the Shape Format tab. Choose a fill color (or no fill for an empty ball) and set the outline color and weight to match your slide theme.
- Go back to the Insert tab. Click Shapes again and select the Partial Circle (found under Basic Shapes). Draw it at the same size as your full circle, holding Shift.
- Format the partial circle with a contrasting fill color — this becomes the filled portion of the Harvey Ball.
- Place the partial circle exactly on top of the full circle. Use the yellow dot handles to adjust the fill angle — drag to represent 25%, 50%, 75%, or any custom percentage.
- Select both shapes, hold Shift, and click each. Right-click and choose Group > Group (or press Ctrl+G) to merge them into one movable object.
To create additional Harvey Balls: right-click your grouped shape, choose Copy, then Paste. Ungroup (Ctrl+Shift+G), adjust the angle of the partial circle, then regroup. This Copy+Paste approach is the fastest way to add Harvey Balls to your slides consistently.
Method 2: Insert Harvey Balls in PowerPoint Using Built-In Icons
This method is available in Microsoft 365 and recent versions of PowerPoint. It is the quickest way to insert them when you only need standard fill levels.
- Go to the Insert tab → Icons.
- Search for Harvey Balls or Circles in the search box to find available options.
- Select the icon that matches your desired fill level and insert it onto your slide.
- Customize the color via the Graphics Format tab to match your presentation theme.
This method is fast for standard fill levels (0%, 25%, 50%, 75%, 100%) but offers less flexibility for custom percentages. The Harvey Ball icon library covers all standard states out of the box.
Method 3: How to Insert Harvey Balls Using Segoe UI Symbol Font
This method uses pre-built Harvey Ball characters from the Segoe UI Symbol font. It is especially useful when you need to insert them directly inside table cells.
- Click inside a text box or table cell where you want the Harvey Ball.
- Go to the Insert tab → Symbol (the Omega symbol Ω, far right of the ribbon).
- In the Symbol dialog box, set the Font dropdown to Segoe UI Symbol.
- Find these circle characters: ○ (empty), ◔ (quarter), ◑ (half), ◕ (three-quarter), ● (full). Select your level and click Insert.
- Resize the symbol by increasing the font size. Change the color using the standard font color tool.
This method works well for inserting Harvey Balls inside PowerPoint tables, where drawing shapes can be awkward. However, these are text characters and may not render consistently across all devices or printers.
Harvey Balls Chart vs. Alternative Data Visualization Tools
A Harvey Ball chart is not always the right choice. Here is how it compares to common alternatives:
| Visual Tool | Best For | Weakness |
|---|---|---|
| Harvey Balls | Qualitative comparisons, project status, ratings | Not precise for exact numbers |
| Pie Charts | Showing proportions/market share of a whole | Hard to compare across categories |
| Bar Charts | Quantitative trends and category comparisons | Can feel cluttered in dense tables |
| Infographics | Storytelling with mixed data types and context | Time-consuming to create |
When to Choose Harvey Balls
Use a Harvey Ball chart layout when you need to compare qualitative attributes side by side — especially in comparison tables. They work best when your audience needs to scan multiple items quickly, and the data does not require numerical precision.
When to Choose an Alternative
Use pie charts when showing proportions of a whole. Use bar charts when comparing numerical values or showing trends over time. Use infographics when you need to tell a data story. For highly precise data, a labeled chart will always outperform Harvey Balls.
Pros and Cons of Harvey Balls in Presentations
Pros
- Quick visual comparison: Audiences understand the relative state of multiple attributes at a single glance.
- Simplifies complex qualitative data: Converts nuanced assessments into universally readable symbols.
- Space-efficient: Replaces paragraphs of descriptive text or large tables with compact, scannable icons.
- Works across language barriers: Visual symbols communicate meaning without relying on language.
- Highly customizable: Size, color, and fill can be adapted to any presentation theme or brand guideline.
Cons
- Not suitable for precise numerical data: Harvey Balls communicate relative levels, not exact values. If accuracy matters, use a labeled chart.
- Risk of misinterpretation without a legend: Audiences unfamiliar with Harvey Balls may not understand fill levels. Always include a key.
- Limited granularity: Beyond four to five levels, differences between balls become difficult to distinguish at a glance.
- Can appear subjective: Because fill levels represent qualitative judgment, stakeholders may question ratings if criteria are not clearly defined.
Tips for Creating Perfect Harvey Balls in PowerPoint
- Always hold Shift when drawing circles and partial circles to maintain perfect symmetry.
- Use the same size for all Harvey Balls on a slide — inconsistent sizing signals a lack of care.
- Choose high-contrast colors for filled vs. unfilled portions. Dark fill on a light outline (or vice versa) works best.
- Always include a legend. Label what each fill level means (0% = Not Started, 100% = Complete) either on the slide or in a footnote.
- Use Copy + Paste to duplicate Harvey Balls rather than recreating them, then ungroup and adjust the angle only.
- Group your shapes (Ctrl+G) before moving them across slides to prevent accidental misalignment.
- Keep it to five levels maximum. More than five becomes hard to distinguish at a glance and defeats the purpose.
Harvey Balls PowerPoint Templates by SlideUpLift
Creating Harvey Balls from scratch for every presentation is time-consuming. SlideUpLift offers professionally designed Harvey Balls PowerPoint templates that are fully editable in both Microsoft PowerPoint and Google Slides.
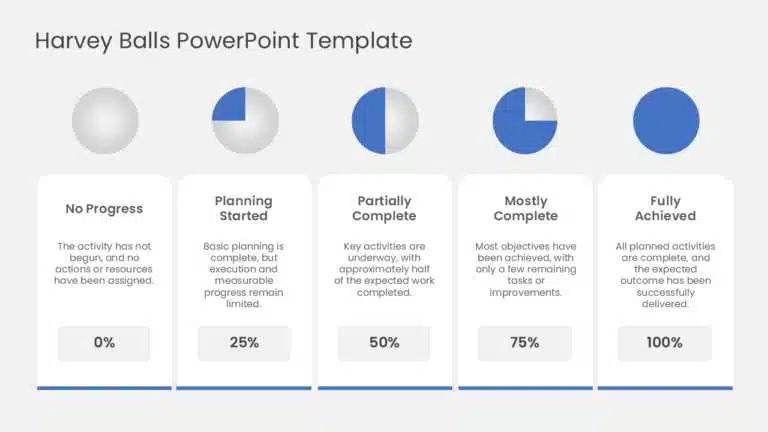
1. Harvey Balls PowerPoint Template
A clean, focused template featuring four Harvey Balls with percentage labels. Ideal for progress tracking, completion dashboards, and simple qualitative comparisons. Fully customizable colors and percentages.
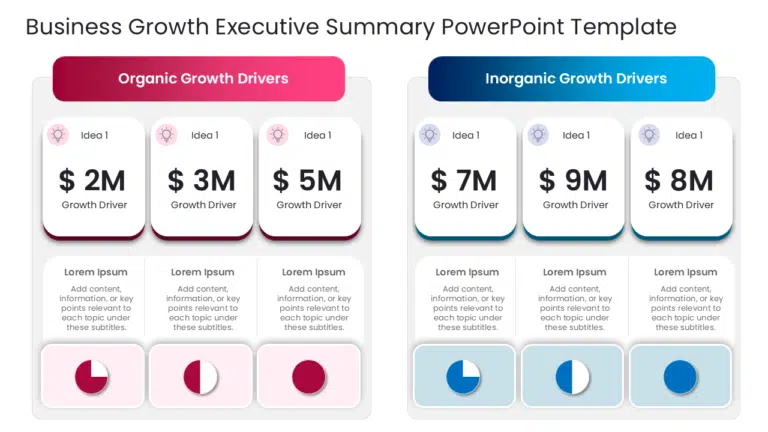
2. Business Growth Executive Summary PowerPoint Template
Covers market analysis, strategic initiatives, sales performance, and financial metrics with Harvey Balls representing achievement levels across each growth factor. Suitable for executive-level presentations to investors and leadership teams.
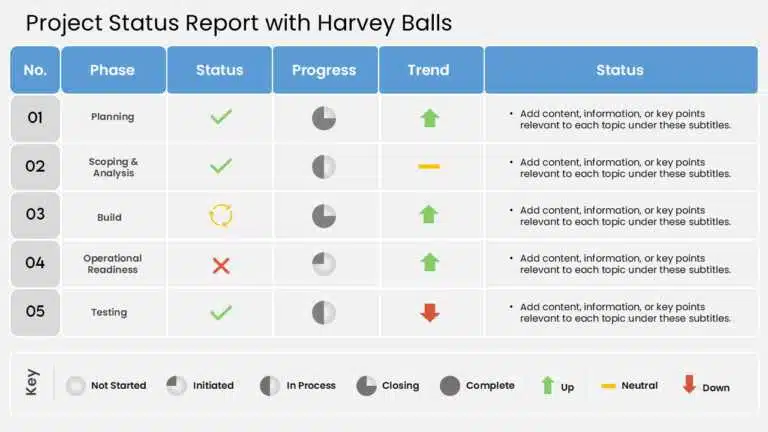
3. Project Status Report PowerPoint Template
This template is designed for live presentations, featuring pre-built Harvey Ball indicators across multiple project dimensions. Use it to communicate task status, risks, and project dependencies in an engaging, dynamic format.
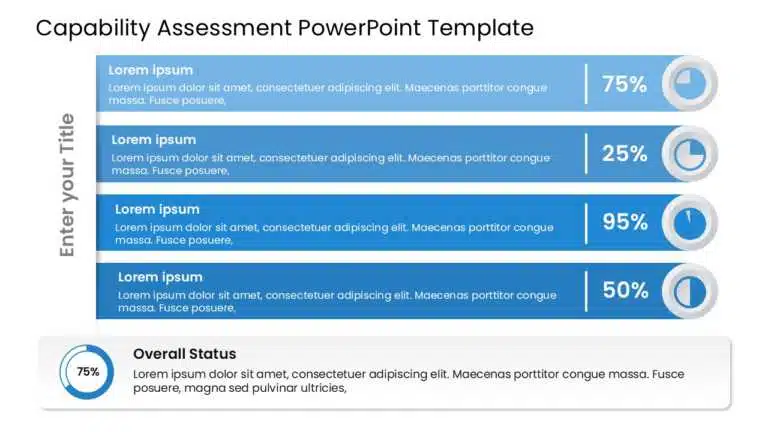
4. Capability Assessment PowerPoint Template
Structured around four sections — Increase Revenue, Estimated Growth Potential, Required Capabilities, and Capability Assessment — this template supports Harvey Ball analysis for SWOT-style organizational reviews. Fully editable and ready to use.
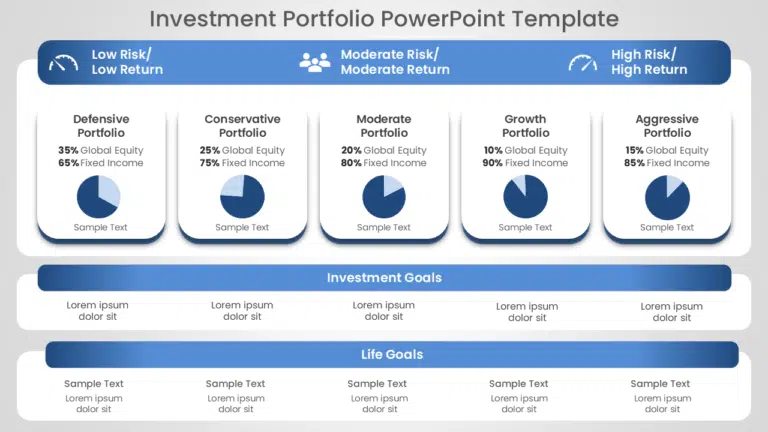
5. Investment Portfolio PowerPoint Template
Designed for financial reporting, this template uses Harvey Balls to communicate asset performance, diversification, and risk profile. Useful for portfolio reviews, investor updates, and strategic planning sessions.
6. Harvey Balls Template Collection
A comprehensive set of Harvey Ball icons and chart layouts in multiple styles and configurations. Download once and repurpose across different project types, reports, and presentations. This collection is particularly useful for teams that regularly use Harvey Balls across departments.
Conclusion
Harvey Balls are one of the most effective visual tools available for presenting qualitative data in PowerPoint. Whether you are tracking project milestones, comparing product features, evaluating employee performance, or summarizing survey results, they allow your audience to absorb complex comparisons in seconds.
The three methods covered in this guide — Manual Shapes, Built-In Icons, and Segoe UI Symbol — give you the flexibility to make Harvey Balls regardless of your PowerPoint version or workflow. For teams that use them regularly, SlideUpLift’s ready-made Harvey Balls PowerPoint templates eliminate the creation process entirely and ensure consistent, professional results every time.
Whether you need a Harvey Ball slide for a project status update or a full comparison dashboard, use the tips and methods in this guide to keep your visuals consistent, legible, and clearly labeled.
FAQs
-
Who invented Harvey Balls?
Harvey Balls were invented by Harvey L. Poppel, an American management consultant at Booz Allen Hamilton, in the 1970s. He led the firm’s worldwide IT consulting practice, and Harvey Balls were designed to communicate qualitative data quickly within consulting reports and presentations.
-
What is a Harvey Ball, and how is it different from a pie chart?
A Harvey Ball is a partially filled circle used to represent qualitative levels — not quantities — in comparison tables and dashboards. Unlike a pie chart, which shows the proportion of a whole, a Harvey Ball communicates relative status (e.g., partially complete, mostly done) without implying a precise percentage. This makes it ideal for qualitative comparisons where exact numbers are not the focus.
-
What is the ideal number of fill levels for a Harvey Ball?
Four to five levels are the standard: empty (0%), quarter (25%), half (50%), three-quarters (75%), and full (100%). Using more than five levels reduces readability because the visual differences between adjacent balls become too subtle to distinguish at a glance.
-
How do you make Harvey Balls in PowerPoint?
The most reliable method: Insert tab → Shapes → Oval (hold Shift for a perfect circle). Then insert a Partial Circle of the same size, layer it on top, adjust the fill angle using the yellow dot handles, and group both shapes with Ctrl+G. This creates a Harvey Ball that is fully movable and editable. See the full step-by-step guide in the Methods section above.
-
How to add Harvey Balls in PowerPoint using built-in icons?
In Microsoft 365 or recent versions of PowerPoint, go to Insert → Icons and search for Harvey Balls or Circles. Select the icon matching your desired fill level, insert it, and recolor via the Graphics Format tab. This is the fastest way to insert them without drawing shapes manually.
-
How to make Harvey Balls in PowerPoint using a font?
Go to Insert → Symbol → Font: Segoe UI Symbol. Find the circle characters (○, ◔, ◑, ◕, ●) and insert the one matching your fill level. Resize using font size and recolor with the font color tool. This method is ideal when you need to insert Harvey Balls inside table cells.
-
Can I use Harvey Balls on Google Slides?
Yes. You can create Harvey Balls in Google Slides using its circle and arc shape tools, following the same manual method as PowerPoint. SlideUpLift’s Harvey Balls templates are also fully compatible with Google Slides and available for direct download and editing.
-
What are the most common mistakes when using Harvey Balls?
- Using them without a legend, so the audience cannot interpret the fill levels.
- Overcrowding a slide with too many balls makes it hard to identify priorities.
- Using Harvey Balls for precise numerical data, where a labeled chart is more accurate.
- Inconsistent sizing or misalignment across a table reduces visual credibility.
-
Are there alternatives to Harvey Balls for qualitative data?
Yes. Common alternatives include pie charts (proportions), bar charts (quantitative trends), radar/spider charts (multi-attribute comparisons), and traffic light indicators (simpler but less granular). The right choice depends on your data complexity and audience needs.
-
Is there a PowerPoint add-in for Harvey Balls?
Yes — several third-party PowerPoint add-ins can insert Harvey Balls in one click with custom fill percentages. If you prefer not to install an add-in, ready-made Harvey Balls PowerPoint templates achieve the same time saving with no software installation required.
Table Of Content
Related Presentations


Related posts from the same category

18 Oct, 2022 | SlideUpLift
Effective Use of Shapes in PowerPoint To Create Winning Presentations (A Few Examples And A Free Shape Template)
Can the use of shapes influence how our audience thinks and feels about an idea? The answer is a resounding yes if psychologists are to be believed. In numerous studies,

14 Dec, 2022 | SlideUpLift
Make Compelling Visual Presentation Using Isometric Designs
We live in a three-dimensional universe. So, why should you limit yourself to a 2D visuals? The isometric design combines the best of both worlds, providing a 3D design without

14 Jan, 2022 | SlideUpLift
Introducing SmartArt Templates by SlideUplift for PowerPoint Newbies
Every presenter wants to make their presentation slides look visually captivating, but many lack the design abilities to do so. If you are one of them, SmartArt in PowerPoint was

11 Sep, 2022 | SlideUpLift
How To Use Harvey Balls As A Project Status Report
When you want to present a project status report to an audience consider using “Harvey Balls” as a visual tool to communicate progress. The creative use of Harvey Balls in

13 Aug, 2025 | SlideUpLift
How To Create Infographics In PowerPoint For Smarter Visual Storytelling?
As a professional, you might have to host meetings and deliver presentations to your stakeholders and team members. As a host, it's crucial to deliver presentations in a way that

7 Dec, 2022 | SlideUpLift
How To Create Neumorphic PowerPoint Presentation To Dazzle Your Audience?
Neumorphic designs are a relatively recent design style that was first used in the User Interface design of gadgets in the previous decade. The perfect and straightforward design is unexpectedly

28 Mar, 2025 | SlideUpLift
Can ChatGPT Make a PowerPoint Presentation? Step-by-Step Guide
Quick Answer Yes — ChatGPT can make a PowerPoint presentation, and as of May 2026 it can do it in two ways. You can use ChatGPT inside your browser to

10 Nov, 2021 | SlideUpLift
PowerPoint Presentation Tips: How to Make a Good PowerPoint Presentation
A well-crafted PowerPoint presentation can have a lasting impact on your audience. However, creating an effective presentation can be daunting, especially if you are unsure how to make it engaging

24 Jan, 2024 | SlideUpLift
How to Make a Roadmap Presentation That Wins Buy-In
Quick answer: To make a roadmap presentation that lands, tailor it to your audience, build it around a narrative instead of a list of dates, present at the right level

14 Oct, 2022 | SlideUpLift
How To Create Your Perfect Webinar Presentation
Webinars are becoming an increasingly important tool for businesses to connect directly with their customers — to educate and inform, maintain relationships and even build a brand. They're also excellent