 Fall Sale
 Flat 40% off on our Unlimited Access Yearly Membership plan!

Heat Map Templates for PowerPoint
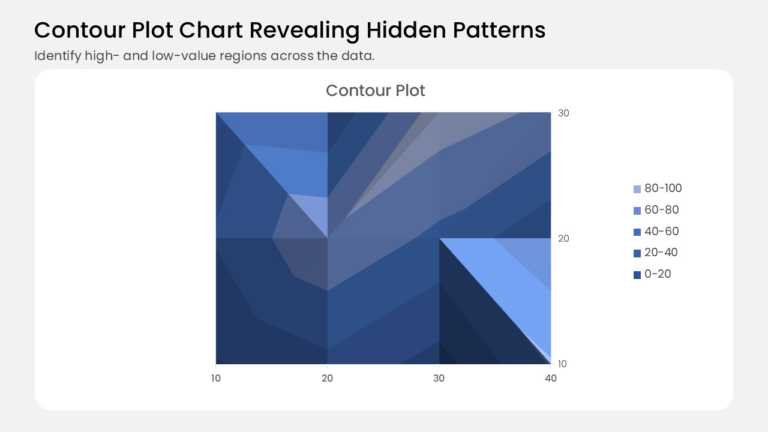
This contour plot turns a grid of values into shaded bands, like a topographic map for your data. It plots 12 data points on a 4 × 3 grid, with 1....


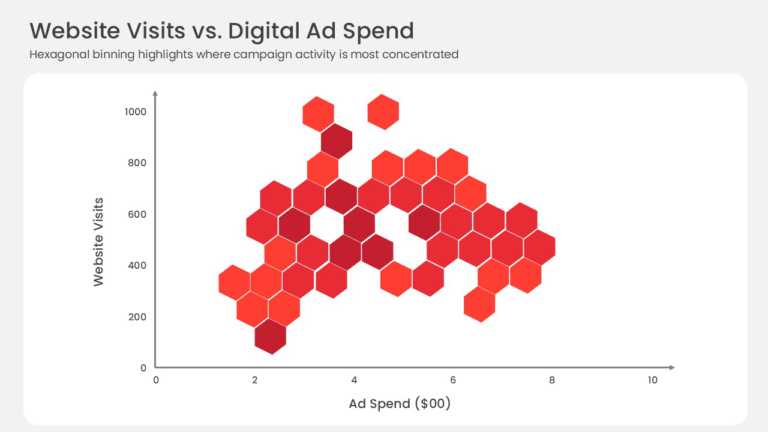
This hexbin scatter plot replaces individual data points with a grid of hexagonal bins plotted against X and Y axes. Color intensity indicates ho....

Tailored for communication and effectiveness is this instrument that elevates your presentations by employing a methodical strategy to assess pot....

Experience the power of this continuum design crafted to illustrate the evolution of health and well being paths boldly! Ideal, for healthcare ex....

Enhance your presentation sequence using this heatmap template created to analyze business effects efficiently and effectively evaluate the conne....

Uncover meaningful insights, from your data using this crafted template showcasing the wellness spectrum journey.It’s a resource for health....

Easily break down concepts using this heatmap design made for illustrating business effects and risk evaluations with ease. This layout showcases....

Share your vision using this Team Matrix template that aims to enhance efforts effectively! This appealing template showcases a color palette of ....

Enhance your data presentation with this heatmap analysis template designed for professionals looking to illustrate information effectively and e....

Make sharing information with this complete RAID Management Dashboard created for project monitoring and control purposes. The layout of this tem....

Enhance your meetings with this matrix created to evaluate the impact of changes effectively and efficiently for project managers and leaders nav....

Enhance your presentations with a flair using the Change Impact Matrix template provided here for you to use freely and creatively in your work e....
Related Presentations
-

Ethical Hacking
3 templates>
-

Network Diagrams
19 templates>
-

Cyber Crime
3 templates>
-

Technology
317 templates>
-

AI
38 templates>
Heatmap PowerPoint Templates For Presentations:
The Heatmap PowerPoint templates go beyond traditional static slides to make your professional presentations stand out. Given the sleek design and customized features, they can be used as PowerPoint as well as Google Slides templates. Inculcated with visually appealing unique and creative designs, the templates will double your presentation value in front of your audience. You can browse through a vast library of Heatmap Google Slides templates, PowerPoint themes and backgrounds to stand out in your next presentation.
Types of Heat Maps
| Heat map type | Use it for |
| Risk matrix (likelihood × impact) | Risk registers, project and audit reviews |
| Comparison grid | Features vs. products, vendors vs. criteria |
| Performance table | KPIs by team, region, or period with a color scale |
| Geographic heat map | Values by country or state — see the maps collection; build steps in the heat map guide |
What Is A Heatmap PowerPoint Template?
A Heatmap PowerPoint template is a ready-made presentation template that provides a structured framework for creating professional Heatmap presentations. The Heatmap PPT presentation template includes design elements, layouts, and fonts that you can customize to fit your content and brand.
How To Choose The Best Heatmap Presentation Templates?
Keep the following points in mind while choosing a Heatmap Presentation template for PowerPoint (PPT) or Google Slides:
- Understand your presentation goals and objectives.
- Make sure the Heatmap template aligns with your visual needs and appeal.
- Ensure the template is versatile enough to adapt to various types of content.
- Ensure the template is easily customizable.
Are Heatmap PowerPoint Templates Compatible With Google Slides?
Yes, all our Heatmap presentation templates are compatible and can be used as Heatmap Google Slides templates.
What Are The Advantages Of Heatmap Presentation Templates?
Heatmap PPT presentation templates can be beneficial because they:
- Add multiple visual and aesthetic layers to your slides.
- Ensure that complex information, insights and data is presented in a simplistic way.
- Enhance the overall visual appeal of the content.
- Save you a lot of time as you don’t have to start editing from scratch.
- Improve the professional outlook of your presentation.
Can I Edit The Elements In Heatmap PowerPoint Templates?
Yes, our Heatmap PowerPoint and Google Slides templates are fully editable. You can easily modify the individual elements including icons, fonts, colors, etc. while making your presentations using professional PowerPoint templates.
How To Download Heatmap PowerPoint Templates For Presentations?
To download Heatmap presentation templates, you can follow these steps:
- Select the resolution (16*9 or 4*3).
- Select the format you want to download the Heatmap template in (Google Slides or PowerPoint).
- Make the payment (SlideUpLift has a collection of paid as well as free Heatmap PowerPoint templates).
- You can download the file or open it in Google Slides.