 Fall Sale
 Flat 40% off on our Unlimited Access Yearly Membership plan!

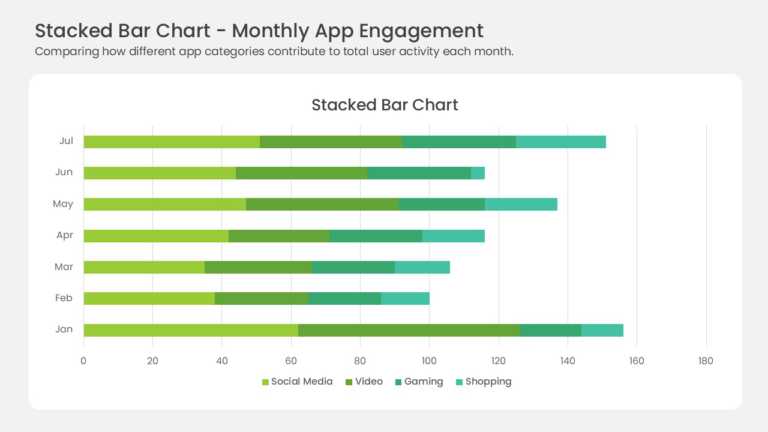
Seven horizontal bars stack four data series across the months January through July. Yellow-green, medium green, teal, and mint segments mark Soc....


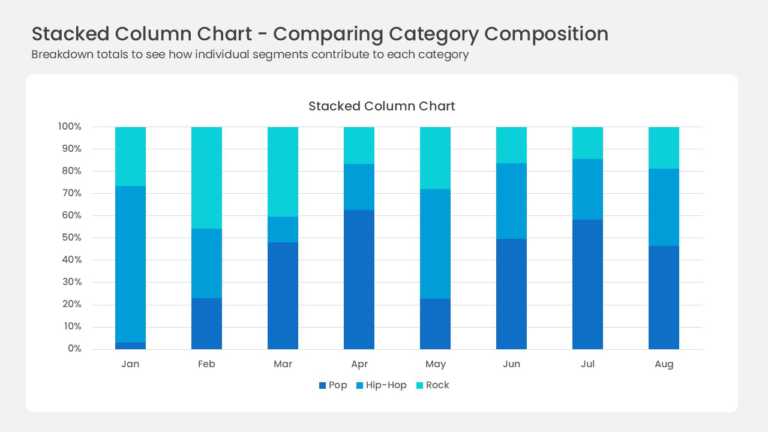
Eight full-height columns run from January to August, each one normalized to 100 percent. Three blue series divide every column: deep navy Pop, b....
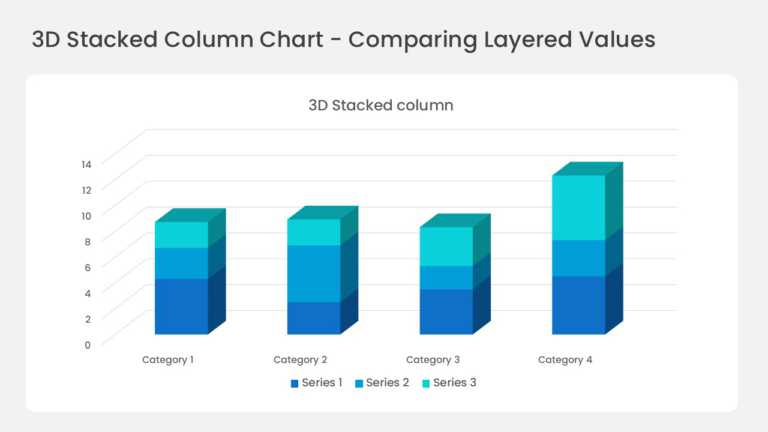
Four three-dimensional columns sit on a perspective floor with gridlines running back into the wall. Each column stacks three series in deep blue....
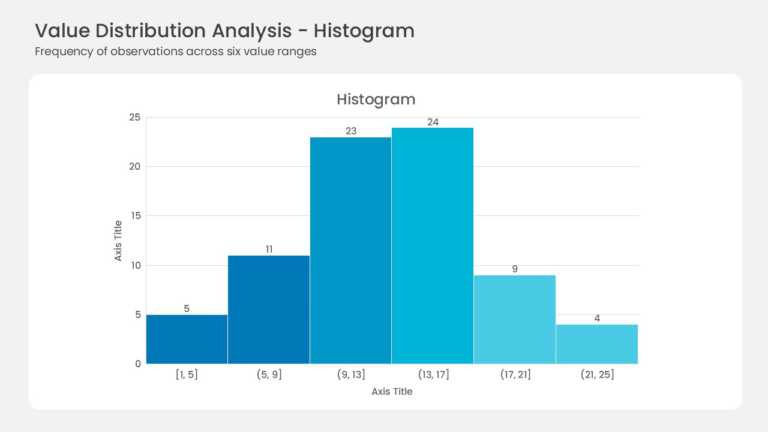
Six adjacent bars form the histogram with no gaps between them. Bin ranges run from [1, 5] up to (21, 25] along the horizontal axis. Frequencies ....
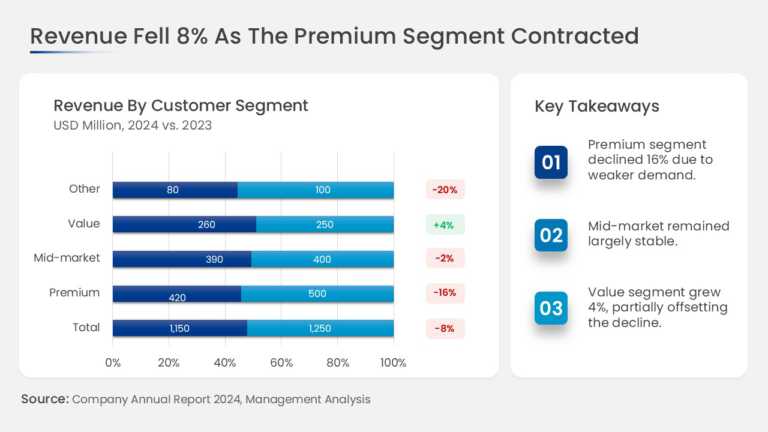
This slide combines a revenue chart broken down by business segment with a dedicated key takeaways panel. The chart area shows the revenue contri....
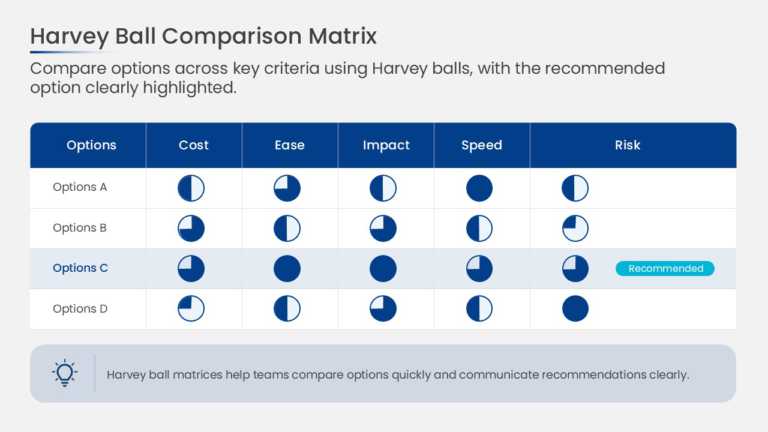
This decision scorecard arranges options in columns and evaluation criteria in rows, with a Harvey Ball in each cell. Circles filled in quarter i....
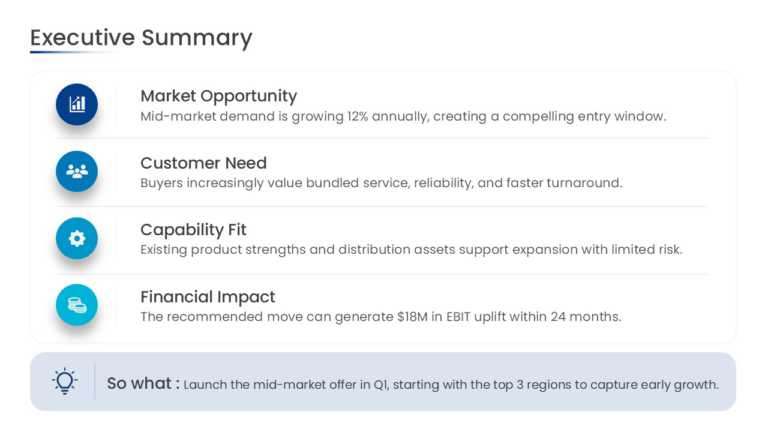
This consulting-style executive summary slide organizes findings into structured key takeaway blocks. Each block pairs a bold headline statement ....

This customer onboarding action plan organizes the onboarding journey into sequential stages. Each stage has space for key tasks, responsible own....
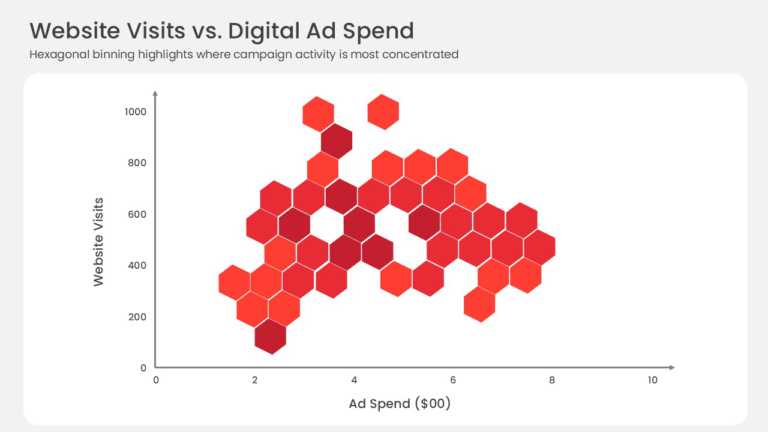
This hexbin scatter plot replaces individual data points with a grid of hexagonal bins plotted against X and Y axes. Color intensity indicates ho....