 Fall Sale
 Flat 40% off on our Unlimited Access Yearly Membership plan!

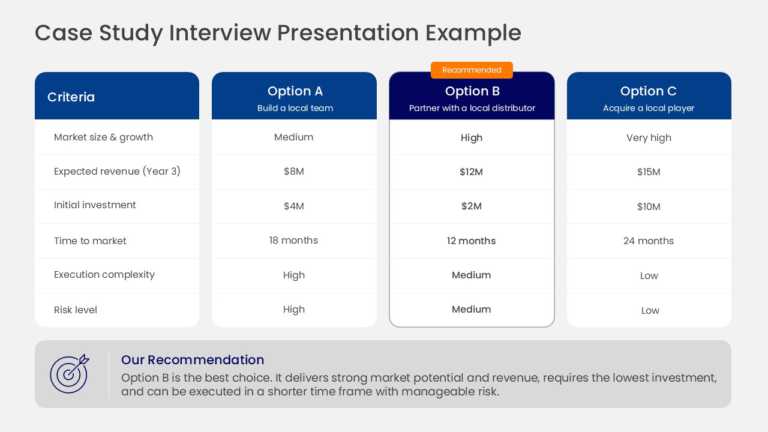
A 3-option business decision matrix that scores Options A, B and C against six criteria, with a highlighted recommended column. The criteria run ....



This 7-slide sales interview deck uses a clean card layout. The design features deep navy, warm amber, and slate gray tones. First, the title sli....

This 8-slide marketing interview template uses a modern card layout. The slides feature rich plum, soft blush, and warm gold colors on white card....
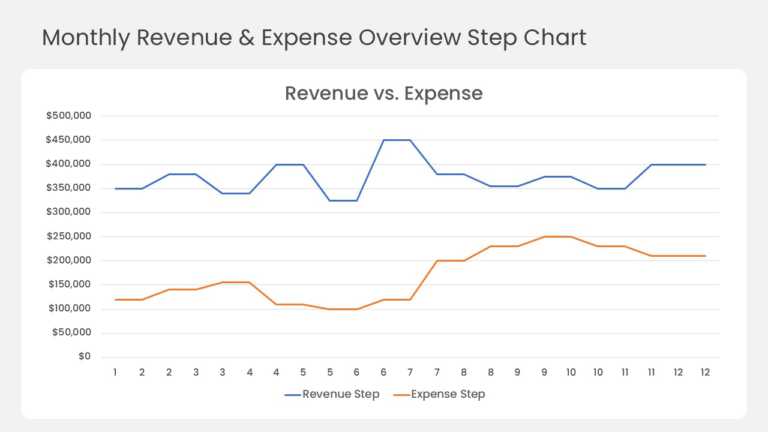
This step line chart compares monthly revenue and expenses across a full 12-month year. A blue revenue line and an orange expense line run across....
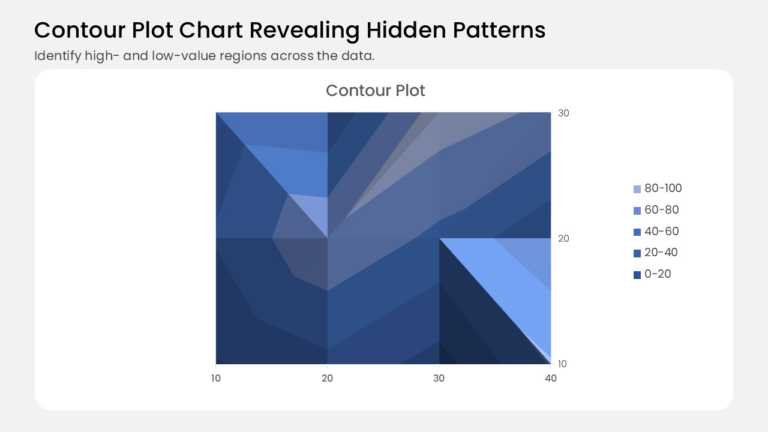
This contour plot turns a grid of values into shaded bands, like a topographic map for your data. It plots 12 data points on a 4 × 3 grid, with 1....
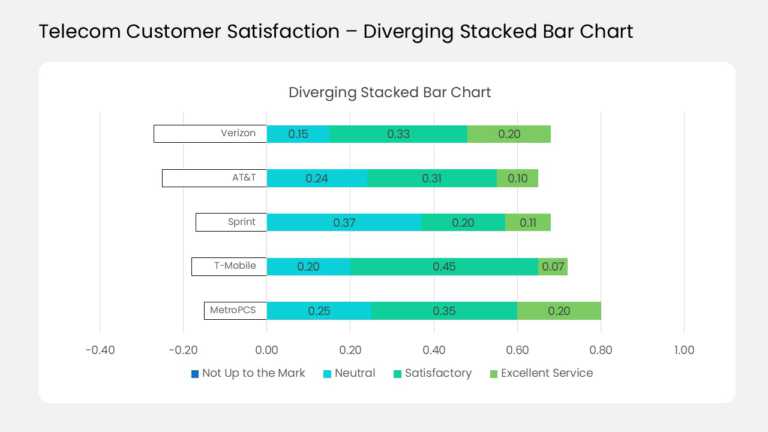
This diverging stacked bar chart compares customer ratings for five sample telecom carriers in one view. Each horizontal bar splits at a zero lin....
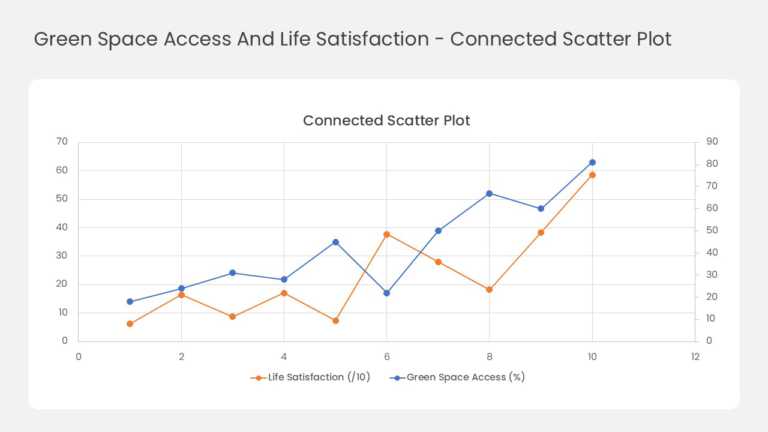
This two-series line chart tracks how two related measures move together across ten data points. Orange markers plot life satisfaction against th....
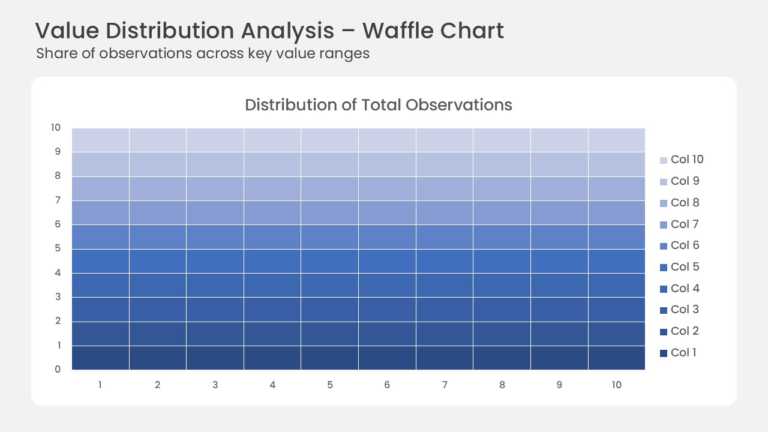
This waffle chart shows how a total splits across ten value ranges on a 10 × 10 grid. Each of the 100 cells stands for one percent of all observa....
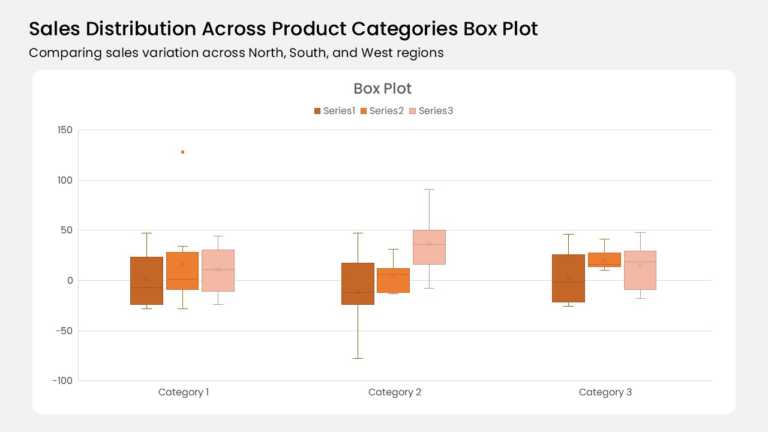
Three category groups anchor this box plot, and each group holds three color-coded boxes. A burnt orange, mid orange, and pale peach series run l....