 Fall Sale
  Flat 40% off on our Unlimited Access Yearly Membership plan!

Cool PowerPoint Templates
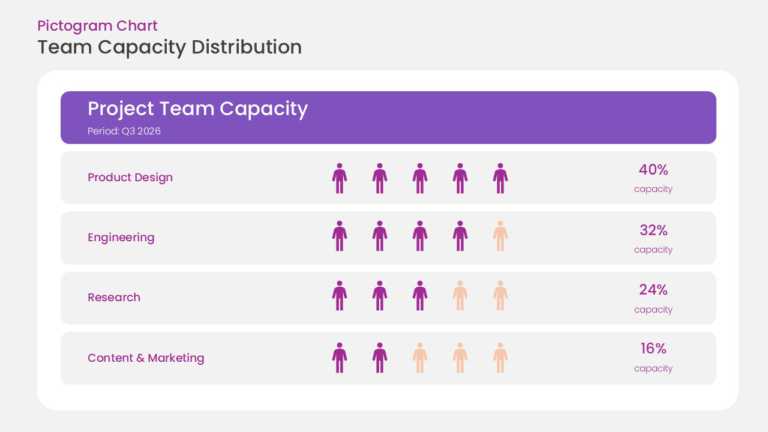
This pictogram chart uses rows of repeated person icons to represent resource capacity. Filled icons indicate allocated resources and unfilled ic....


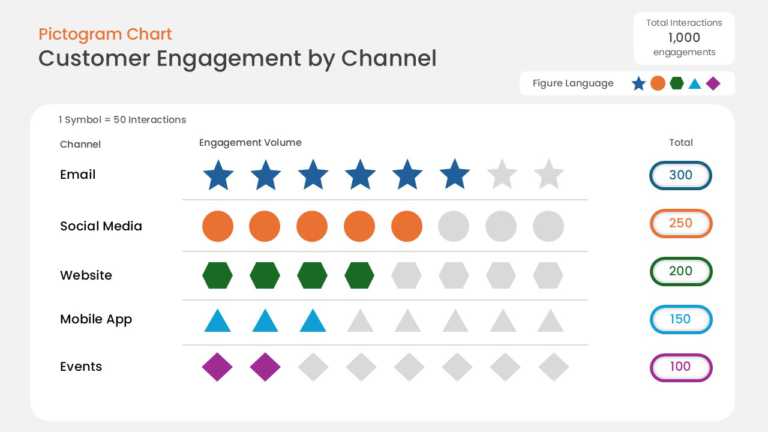
This data pictogram chart expresses values as rows of repeated icons, with filled icons showing the measured share and unfilled icons showing the....
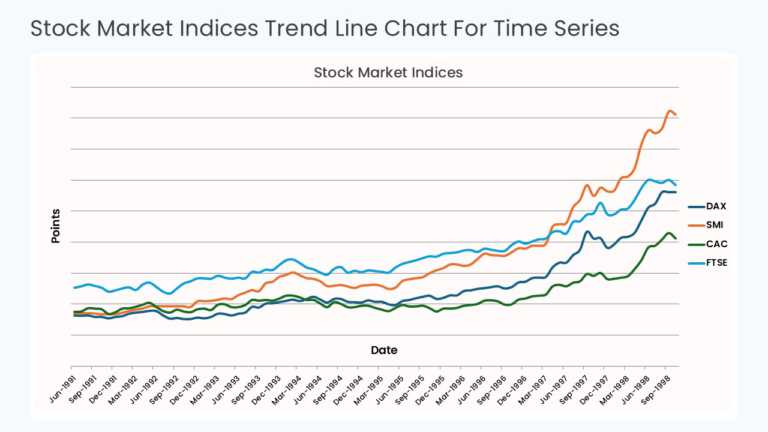
This time series chart plots values against sequential time periods on the X axis, with a trend line connecting each data point. Gridlines and ax....
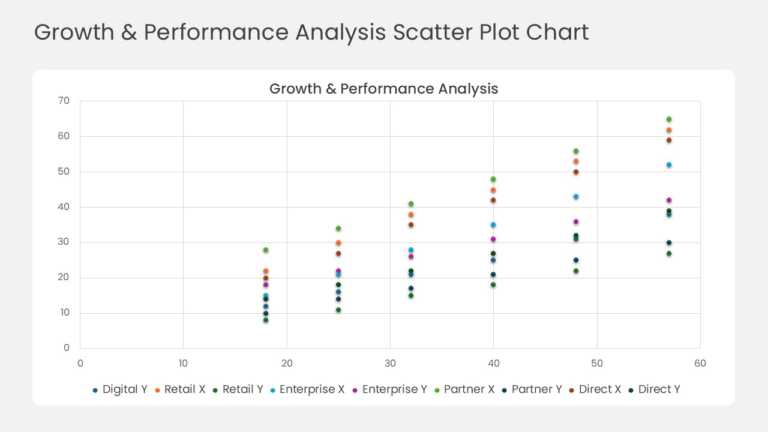
This scatter plot maps business units, products, or regions as individual data points across two performance metrics on the X and Y axes. The lay....

This cover slide opens a market expansion strategy deck with a prominent title area, a subtitle line, and space for presenter or date details. Th....
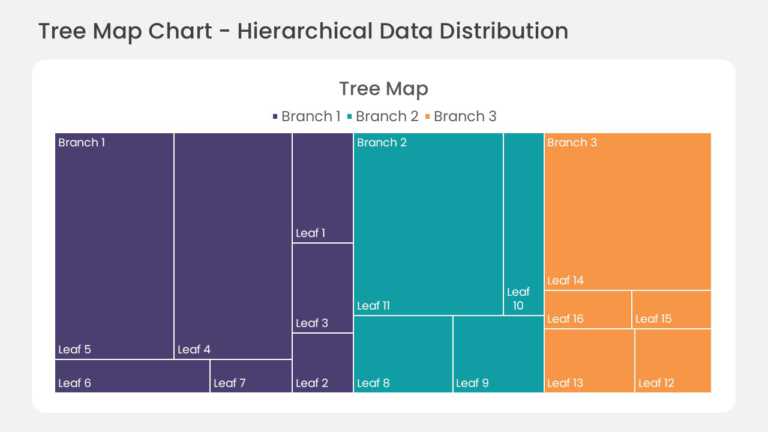
This hierarchical treemap chart divides the slide area into nested rectangles, with each rectangle sized by its share of the total value. Child s....

This section tracker slide lists the main sections of a presentation in sequence and highlights the section currently in progress. Visual markers....
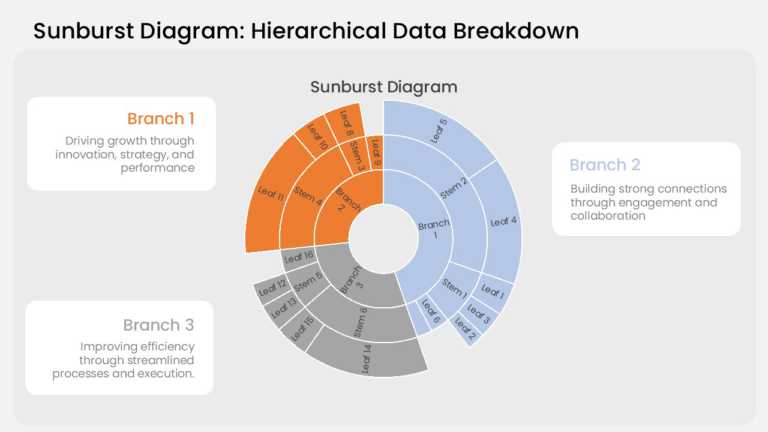
This sunburst chart arranges hierarchical data in three concentric rings. The inner ring holds the top-level categories, the middle ring breaks e....
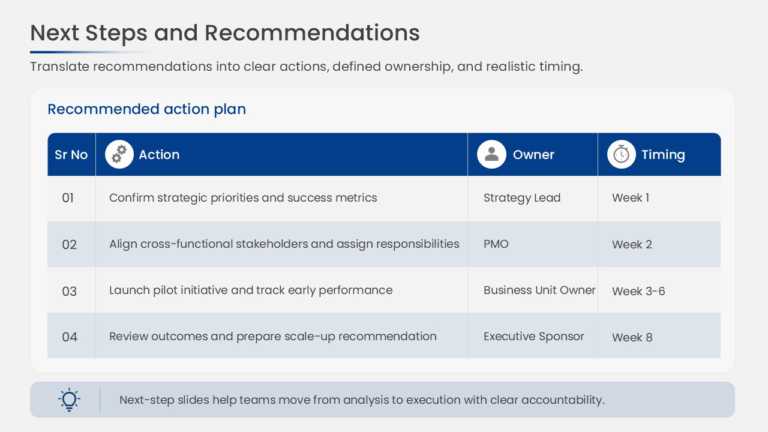
This project action plan uses a structured table with columns for action items, responsible owners, due dates, and status. Each row represents on....
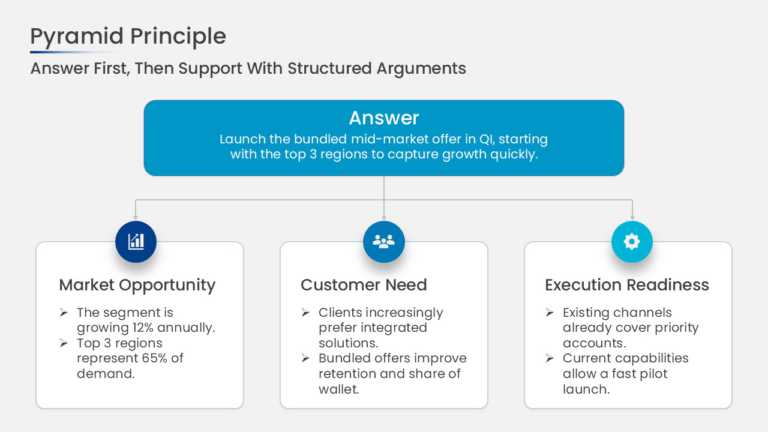
This pyramid principle slide places a single governing thought at the top of the structure with 3 supporting arguments arranged beneath it. Conne....
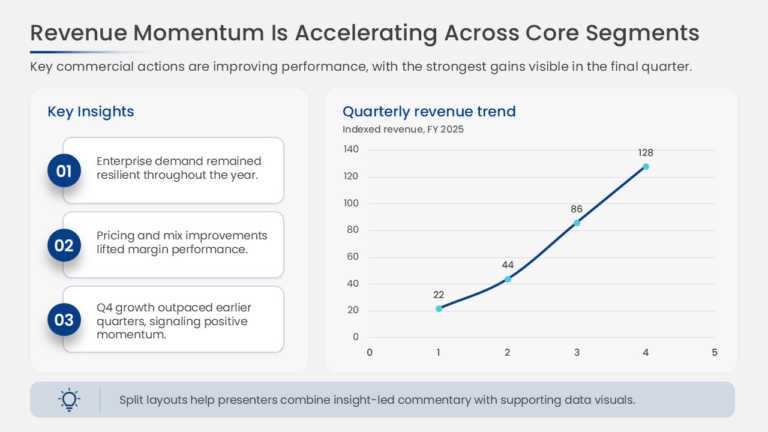
This slide charts revenue across quarters to show period-over-period growth and pairs the chart with insight callouts that explain the drivers be....
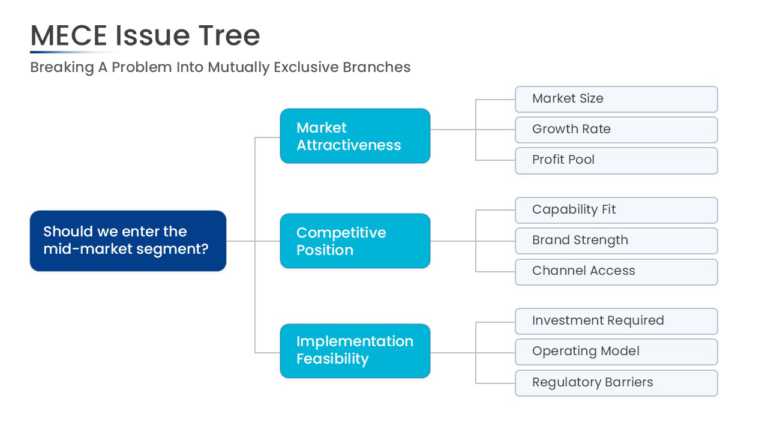
This MECE issue tree starts with a root problem statement on the left and splits it into 3 primary branches. Each branch extends into sub-issues,....
How To Make Cool PowerPoint Slides?
Infographics are probably the best way to make your business presentations more attractive and attention-grabbing. It results in increased engagement as compared to other visual media. And also make sure to choose the font size appropriately, use strong contrast with the text, and try not to use too much text and too many colors on your PowerPoint slides.
How to make Cool PowerPoint presentation?
To make your presentations more appealing and memorable you need cool backgrounds, simple transitions, clean fonts, & attractive graphics to make the presentation more engaging.
Here are a few ways to make a cool presentation,
- Use a consistent theme
- Use more images & less text
- Use animations to highlight each bullet point
- Convey one message in each slide
- Use 2/4/8 rule - The 2/4/8 rule is-don't spend more than 2 minutes on a one slide, don't use more than 4 bullets per slide, and no more than 8 words per bullet.