 Fall Sale
  Flat 40% off on our Unlimited Access Yearly Membership plan!

Cool PowerPoint Templates
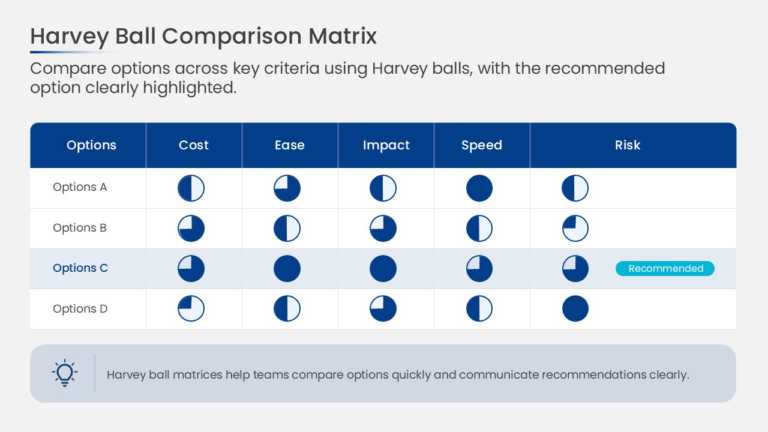
This decision scorecard arranges options in columns and evaluation criteria in rows, with a Harvey Ball in each cell. Circles filled in quarter i....


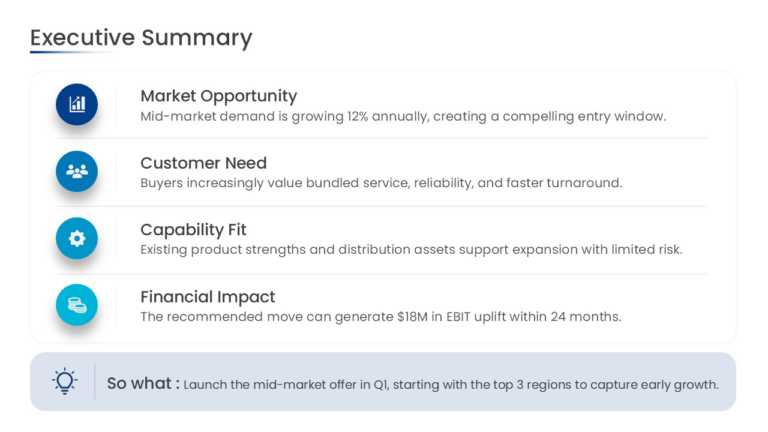
This consulting-style executive summary slide organizes findings into structured key takeaway blocks. Each block pairs a bold headline statement ....

This customer onboarding action plan organizes the onboarding journey into sequential stages. Each stage has space for key tasks, responsible own....
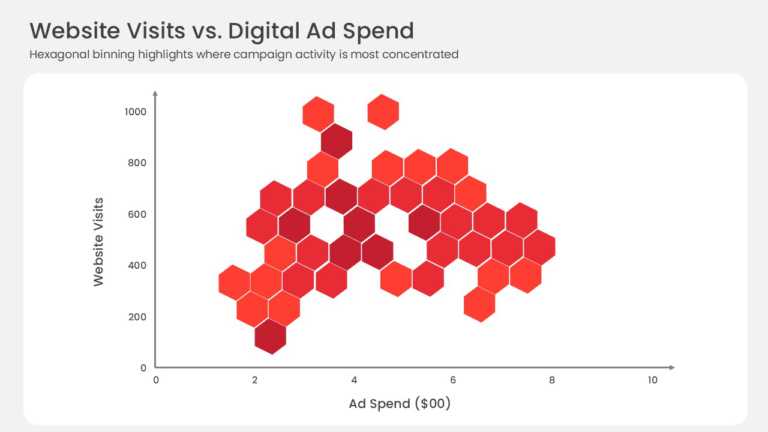
This hexbin scatter plot replaces individual data points with a grid of hexagonal bins plotted against X and Y axes. Color intensity indicates ho....
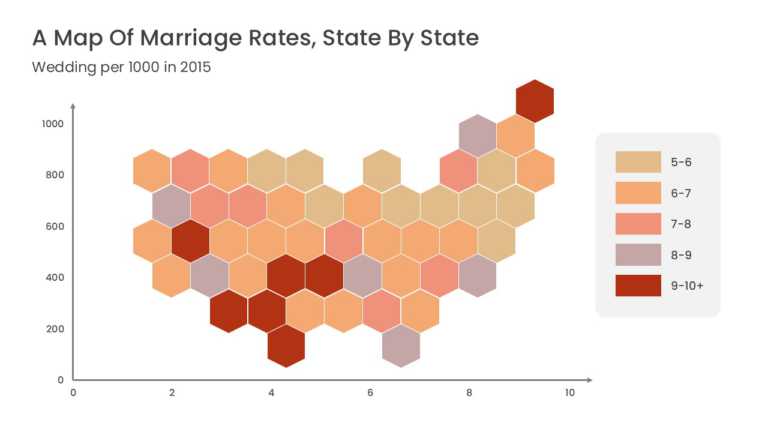
This US data map represents each state as a uniform hexagonal tile arranged in the approximate geographic layout of the country. Equal tile sizes....
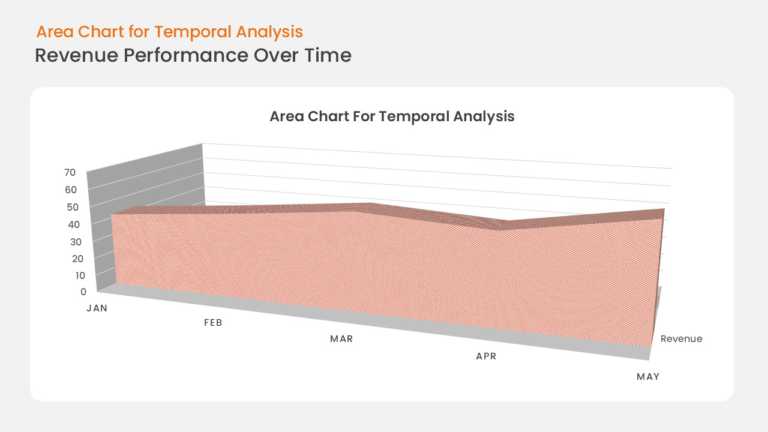
This area chart plots business growth along a time-based X axis, with the region under the trend line filled to emphasize volume and momentum. Ax....
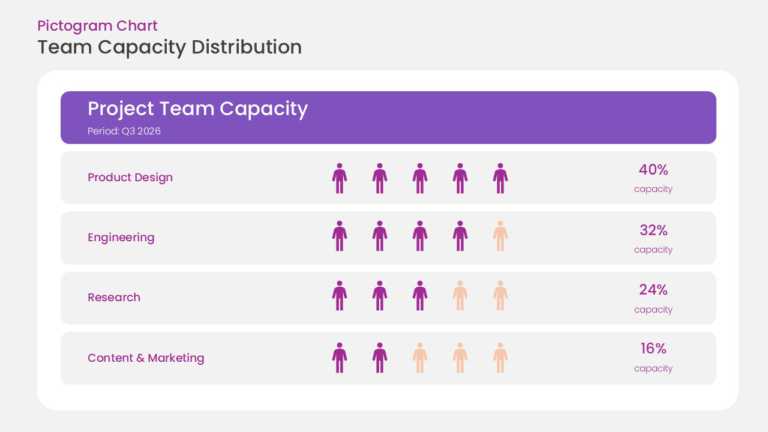
This pictogram chart uses rows of repeated person icons to represent resource capacity. Filled icons indicate allocated resources and unfilled ic....
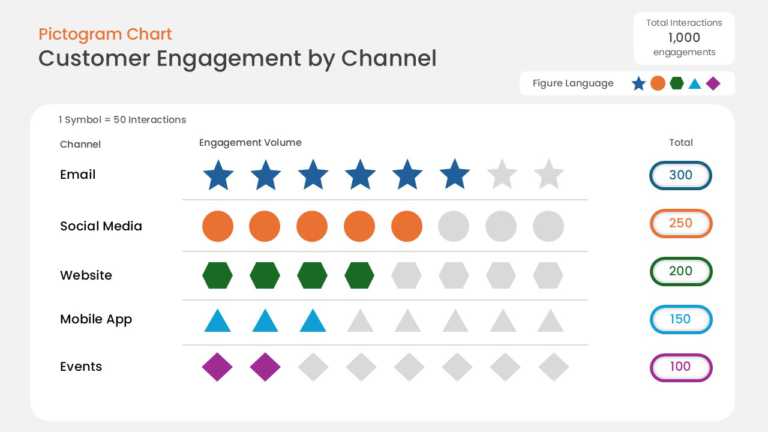
This data pictogram chart expresses values as rows of repeated icons, with filled icons showing the measured share and unfilled icons showing the....

Opportunities are positioned on a bubble chart by market attractiveness and competitive position, and bubble size adds a third measure for revenu....
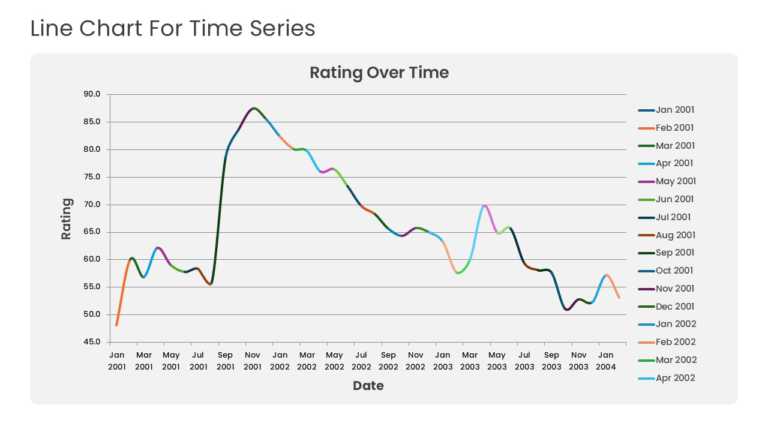
Multiple years of historical data run across a time-series line graph with point markers and gridlines. The layout highlights baseline momentum, ....
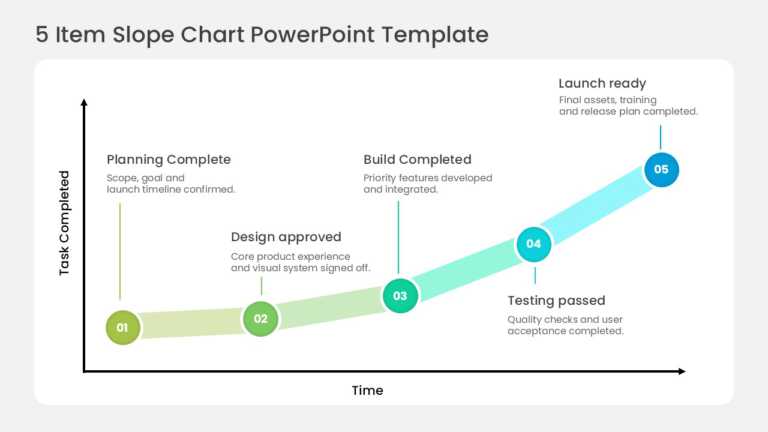
Five circular nodes climb an upward slope, tracking milestone completion across sequential delivery phases. The stages run from scope confirmatio....
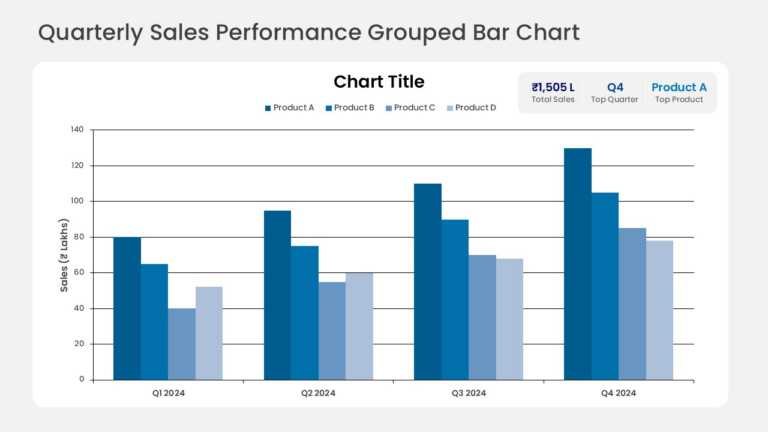
Grouped columns compare quarterly sales across several product lines, with one column per product in each quarter. KPI callout cards above the ch....
How To Make Cool PowerPoint Slides?
Infographics are probably the best way to make your business presentations more attractive and attention-grabbing. It results in increased engagement as compared to other visual media. And also make sure to choose the font size appropriately, use strong contrast with the text, and try not to use too much text and too many colors on your PowerPoint slides.
How to make Cool PowerPoint presentation?
To make your presentations more appealing and memorable you need cool backgrounds, simple transitions, clean fonts, & attractive graphics to make the presentation more engaging.
Here are a few ways to make a cool presentation,
- Use a consistent theme
- Use more images & less text
- Use animations to highlight each bullet point
- Convey one message in each slide
- Use 2/4/8 rule - The 2/4/8 rule is-don't spend more than 2 minutes on a one slide, don't use more than 4 bullets per slide, and no more than 8 words per bullet.