 Fall Sale
 Flat 40% off on our Unlimited Access Yearly Membership plan!

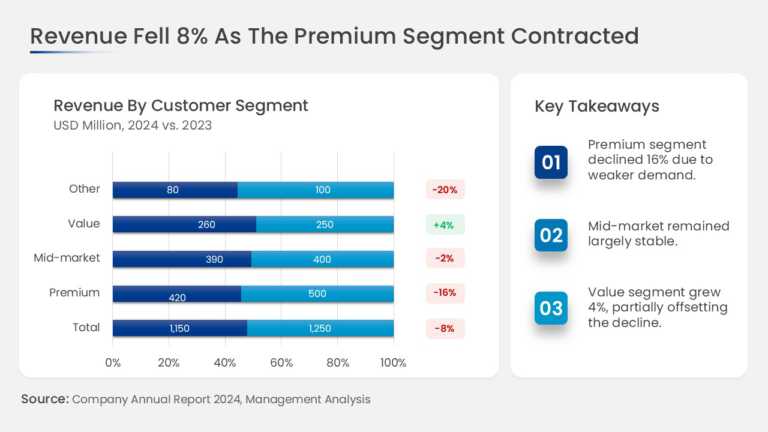
This slide combines a revenue chart broken down by business segment with a dedicated key takeaways panel. The chart area shows the revenue contri....


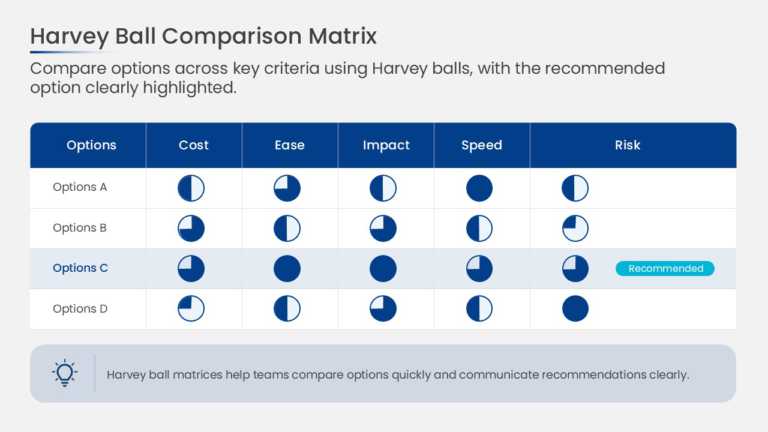
This decision scorecard arranges options in columns and evaluation criteria in rows, with a Harvey Ball in each cell. Circles filled in quarter i....
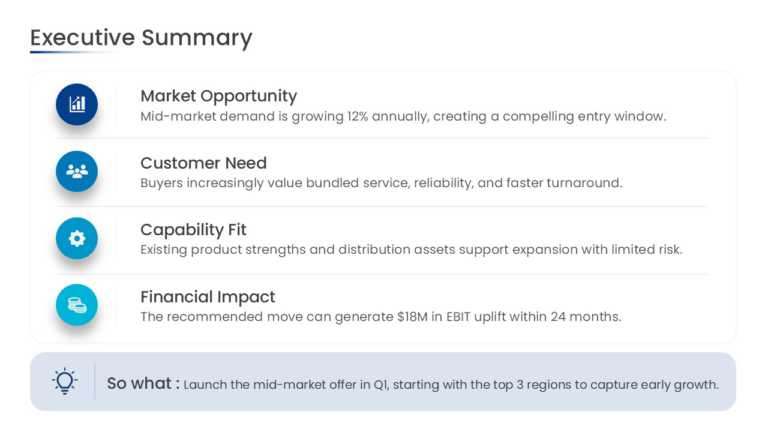
This consulting-style executive summary slide organizes findings into structured key takeaway blocks. Each block pairs a bold headline statement ....

This customer onboarding action plan organizes the onboarding journey into sequential stages. Each stage has space for key tasks, responsible own....
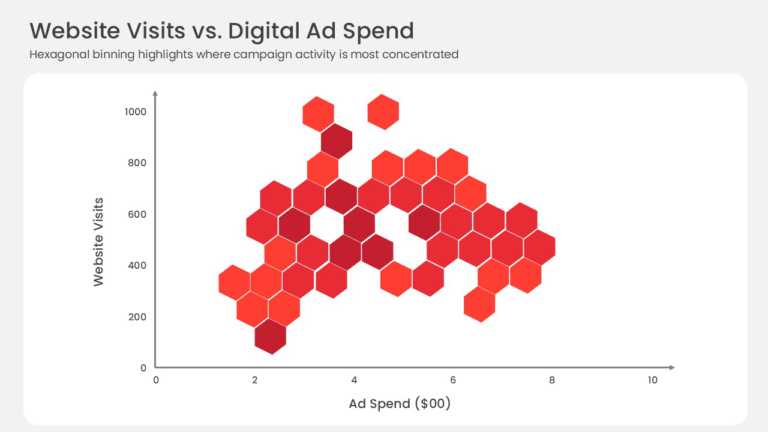
This hexbin scatter plot replaces individual data points with a grid of hexagonal bins plotted against X and Y axes. Color intensity indicates ho....
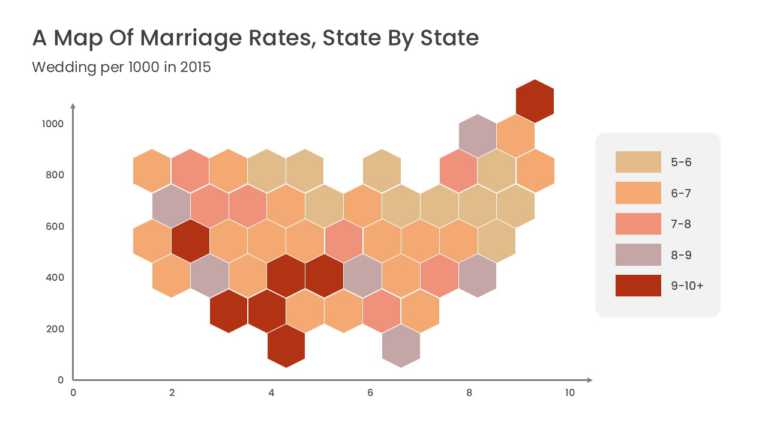
This US data map represents each state as a uniform hexagonal tile arranged in the approximate geographic layout of the country. Equal tile sizes....
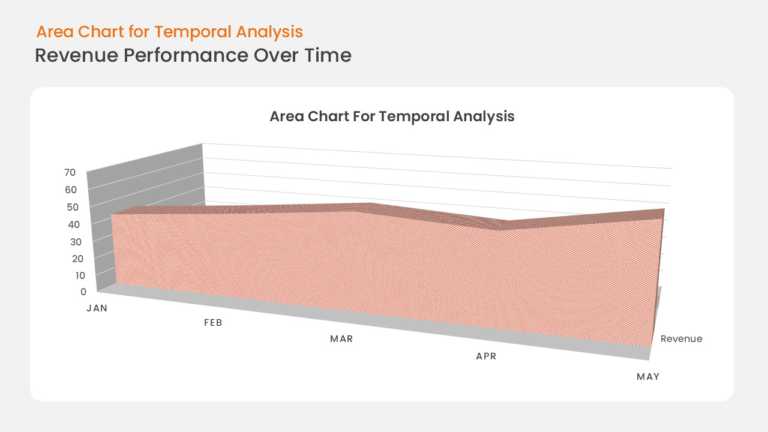
This area chart plots business growth along a time-based X axis, with the region under the trend line filled to emphasize volume and momentum. Ax....
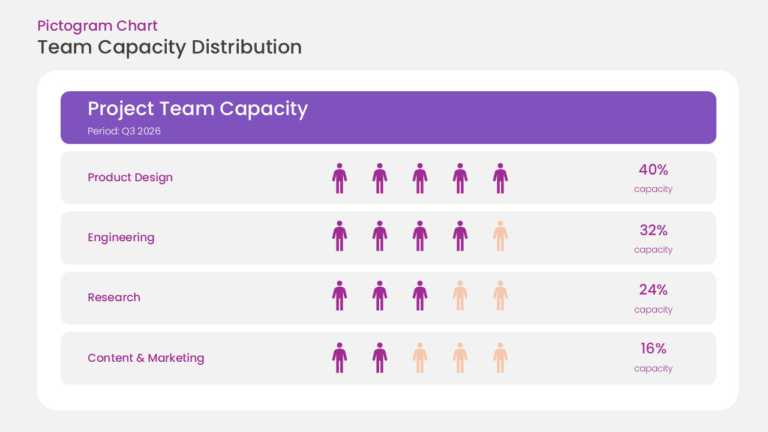
This pictogram chart uses rows of repeated person icons to represent resource capacity. Filled icons indicate allocated resources and unfilled ic....
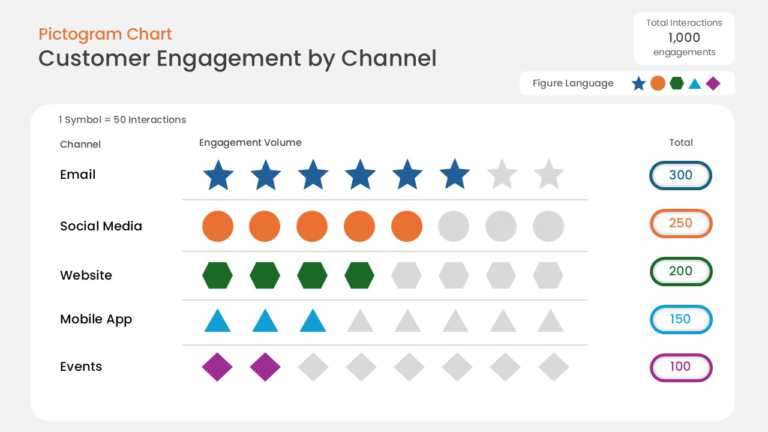
This data pictogram chart expresses values as rows of repeated icons, with filled icons showing the measured share and unfilled icons showing the....
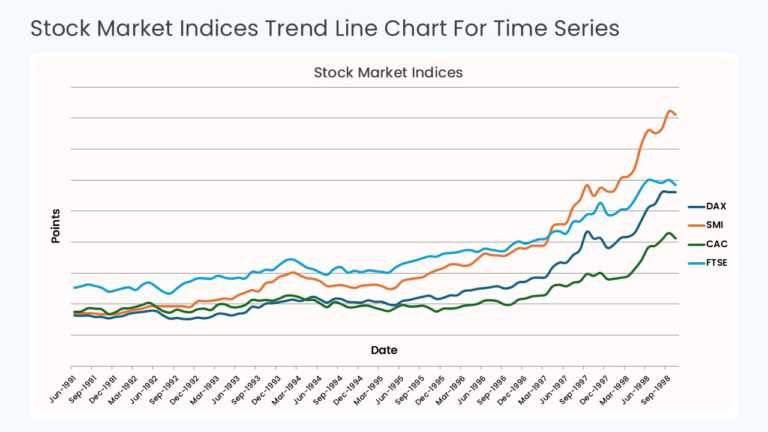
This time series chart plots values against sequential time periods on the X axis, with a trend line connecting each data point. Gridlines and ax....


A clean, white-background Christmas template with trees framing both sides, gold stars, and sparkle accents for a polished, festive look. Include....

A Christmas background featuring snowy pine trees on a warm, paper-textured backdrop — a softer, tactile alternative to typical glossy holiday te....